
Caveats About Analyzing LAT Pass 8 (P8R3_V3) Data
These caveats are relevant for the P8R3_V3 version of the Pass 8 photon dataset. They supersede the set of caveats for analysis of the previous version of P8R3 (P8R3_V2), the initial version of Pass 8 (P8R2), Pass 7 reprocessed (P7REP), Pass7 (P7_V6) and Pass 6 (P6_V3 and P6_V11) event selections and Instrument Response Functions (IRFs).
The LAT team is still working to validate all aspects of Pass 8 data and analysis. As a consequence it is expected that, in the coming years, the range of application of Pass 8 data will be increased, the tools and files will be improved and the systematic uncertainties will be decreased. These caveats will be modified accordingly.
The P8R3_V3 IRFs are defined between 5.62 MeV and 3.16 TeV but that does not mean that they have been fully validated over this whole energy range. Following the Pass 7 validation effort, the LAT team has started performing studies in order to check the consistency and precision of the instrument simulation and the instrument response representation provided by the IRFs. These studies are based on the analysis of Vela (E < 10 GeV), bright AGN (3 GeV < E < 100 GeV) and the Earth limb (E > 10 GeV). They include:
- comparing the distributions of reconstructed quantities between data and the simulation of the instrument for a given selection (e.g. SOURCE class)
- comparing the fraction of events of a loose selection (e.g. TRANSIENT020 class) that are accepted in a more stringent selection (e.g. SOURCE class) in data and as predicted by the instrument simulation or the IRFs
- comparing the fraction of events in each event type for a given selection in data and as predicted by the instrument simulation or the IRFs
- comparing the radial profiles of a point source in data and as predicted by the IRFs
The only difference between the previous IRFs (P8R3_V2) and the new IRFs is that we used an in-flight calibration method to change the PSF event type effective areas (as a function of energy and incidence angle) in order to improve the agreement between the observed and predicted numbers of events. The calibration was performed using the Vela pulsar and the Earth limb data. The effective area change is within 20% and the resulting data/model agreement is within 5%.
Energy Range
Either because the disagreement between data and the IRFs prediction is too large or because the validation process was hampered by lack of statistics, using data below 30 MeV or above 1 TeV is strongly discouraged. The effect of energy dispersion is particularly large below 100 MeV where there is a non-negligible positive bias in the LAT energy reconstruction. Therefore it is highly recommended to take into account energy dispersion (see the Pass 8 analysis and energy dispersion page) when analyzing data below 300 MeV, and required below 100 MeV.
Systematic Uncertainty on the Effective Area
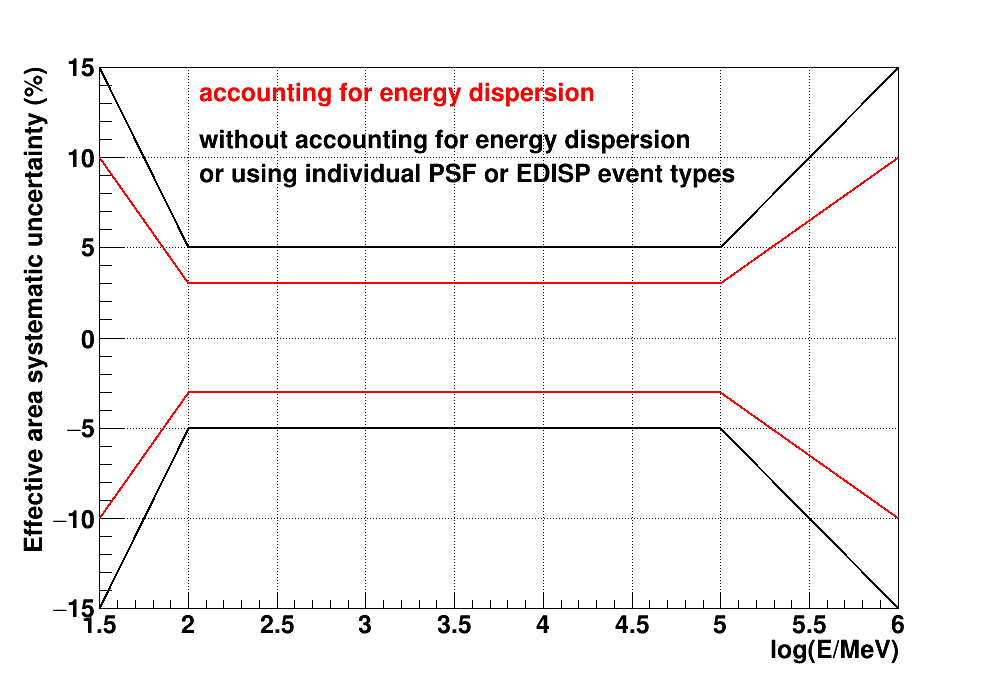
The differences in selection efficiencies between data and the IRFs predictions can be translated into a systematic uncertainty band on the effective area. The uncertainty band brackets as a function of energy the minimum and maximum deviation of the effective area from its nominal value in the IRFs. This uncertainty depends on energy but also on whether or not energy dispersion is taken into account: When using all events or individual event types, the agreement between data and IRF predictions is improved when taking into account energy dispersion. For analyses requiring the smallest possible systematic uncertainties, the LAT team recommends enabling the energy dispersion correction. Note that the Fermitools currently only support the energy dispersion correction for binned likelihood analysis. (See also the Pass 8 analysis and energy dispersion for the recommended practices regarding energy dispersion in Fermitools analysis.)
The following plot shows the systematic uncertainty band of the effective area for two configurations:
- Red Curve: Binned analysis with energy dispersion correction enabled.
- Black Curve: Unbinned or binned analysis with energy dispersion correction disabled, or using individual PSF or EDISP event types.
Systematic Uncertainty on the PSF
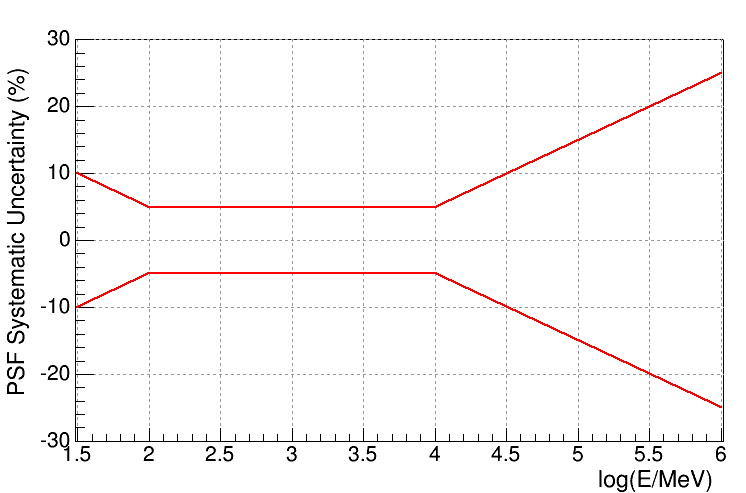
Systematics on the PSF are quantified in terms of the fractional uncertainty on the 68% containment radius (R68) of a point source. The following statements summarize the current findings from PSF validation studies performed with Vela and stacked, high-latitude AGN:
- Between 100 MeV and 10 GeV the systematic uncertainty on R68 is < 5% when considering all events in a class as well as the individual event types (FRONT, BACK, PSF, and EDISP). Outside of this energy range the systematic uncertainty on R68 linearly increases as a function of log(E) to 10% at 30 MeV and 25% at 1 TeV. Note that above 10 GeV the increase in systematic uncertainty is driven by the limited statistics in the AGN validation sample.
- In the P7REP data release, the PSF above 3 GeV was found to be slightly broader than predicted by MC simulations. To provide a more accurate representation of the PSF observed in flight data, the P7REP_V15 IRFs included an in-flight PSF that was derived to correct for this effect. In Pass 8, improvement in the simulation of the instrument reduced this disagreement and validation studies performed with P8R3 data and the P8R3_V2 IRFs show no comparable discrepancy in the PSF at high energies. The measured residuals in R68 are consistent with a systematic uncertainty < 5% and show no clear trend with energy. Since no in-flight PSF correction was determined to be necessary, the PSF representation in the P8R3_V3 IRFs is derived entirely from MC simulations.
The following plot shows the systematic uncertainty band for R68 which applies to all event class and type selections:
Other systematic effects and uncertainties
- The effective area tables are averaged over the azimuthal angle in the LAT instrument reference frame. For time scales of more than a few days this averaging is accurate to better than 1-2%. However, for shorter timescales it is important to use the optional phi-dependent extensions to the livetime when calculating exposures.
- Because the LAT field of view is very large, it is likely that somewhat different biases are relevant in different parts of the field of view. When coupled with the sky survey observational strategy of Fermi, this can cause apparent variability when studying particular sources. The magnitude of such effects depends on the timescale of the study. For example, the 3FGL catalog analysis found the pulsar Geminga to be variable at the 2% level on one-month time scales; an effect which is likely instrumental. Furthermore, dedicated variability studies have seen evidence of 10% variability on the 55-day time scale corresponding to the precession of the LAT orbital plane relative to the Earth's rotational axis. When doing precision variability and time-domain studies, the LAT team recommends using sources at similar declinations to control for these instrument-induced effects. (More information is available on the LAT Temporal Caveats page.)
- The absolute energy scale for the LAT is determined with an uncertainty of +2% -5% For additional details, see In-flight measurement of the absolute energy scale of the Fermi Large Area Telescope (Ackermann, M. et al. 2011 APh, 35, 364).
- The LIVETIME column in the photon FITS file should be ignored. It was intended to contain the livetime accumulated since the start of the current run (data-taking interval, typically ∼1 orbit in duration), but this is not technically feasible. The livetime value resets frequently and this column should be ignored. The LIVETIME accumulations in the spacecraft data files are correct and complete.
- Data collected from the beginning of the mission to 2008-10-27 (MET 246823875) have a significantly higher level of background contamination at energies above ∼30 GeV. On 2008-10-27 a change was introduced to the on-board configuration of the ACD timing parameters that fixed an inefficiency in the ACD trigger "Veto" signals. Several ACD variables that are used in the Pass 8 event classification were affected by this inefficiency resulting in a lower background rejection power prior to the deployment of the new configuration. For analyses using SOURCE class and focusing on energies > 30 GeV it is recommended to exclude data prior to MET 246823875.
- A dedicated analysis searching for narrow spectral features (with width smaller than the LAT energy resolution of 5-10%) has been performed with Pass 8 data in different control regions including the Vela Pulsar, the Earth Limb, and 10x10 degree ROIs along the Galactic Plane. Since no line-like spectral features are expected in these regions, any measured residuals can be attributed to systematic uncertainties in spectral modeling and/or unmodeled energy-dependent variations in the effective area. Between 100 MeV and 100 GeV the measured spectral features in the Limb and Vela Pulsar have a fractional amplitude less than 2%. We also note that a narrow feature at 133 GeV is observed in the Pass 8 Earth Limb data with a fractional size of ∼10%. For ROIs with more than ∼5,000 events, these features can become very statistically significant (since statistical uncertainty is proportional to sqrt(N)). However we note that these features are expected to have little to no impact on typical broadband spectral analyses that use energy bins wider than the LAT energy resolution (e.g. 10 bins per decade).
- For transient sources observed at large incidence angles, the "Fisheye" effect can induce a measurable bias in the PSF. The Fermitools parameterize the PSF with a function that is azimuthally symmetric with respect to the true direction of the incident gamma ray and do not account for this effect. The P8R3_V3 IRFs contain correction tables that can be used to estimate the PSF bias a function of energy and incidence angle. More information regarding the Fisheye correction tables is provided in the PSF IRF page.
Diffuse Models
- Please see the diffuse model page to access the currently-recommended model of Galactic diffuse emission and the corresponding spectrum of the isotropic emission including residual background from cosmic rays misclassified as gamma rays.
- As explained in the diffuse model page, the Pass 8 Galactic diffuse gamma-ray emission was produced by simply rescaling the P7REP Galactic diffuse model in order to correct for energy dispersion. As a consequence, all the caveats applying for the P7REP model also apply for the Pass 8 model. Documentation for the generation of the P7REP diffuse model is provided here.
- The model of Galactic diffuse gamma-ray emission is defined between 58.5 MeV and 513 GeV. To derive the isotropic spectrum at higher energies, we extrapolated the Galactic diffuse emission model. Analyses at energies >100 GeV are likely to be limited primarily by photon statistics, but the accuracy of the modeling of diffuse gamma-ray emission at those high energies is also reduced.
- All the released diffuse models were derived for point sources and compact extended sources studies only, and are not suited for studies of extended sources and/or large-scale diffuse emissions. There is no standard background model for extended diffuse analyses, nor a generic treatment of extended sources and diffuse extended emissions. The approach for such studies depends on the aim and the objective of the study and should be evaluated, treated, and tested on a case-by-case basis.
- Each diffuse model should be used with the corresponding Event Selection and IRF. For example using P6 background models with P7 dataset or P7 background models with P6 dataset is strongly discouraged, because each model was fit to the specific Event Selection and IRF. Ideally the resulting diffuse emission model is independent of IRFs used to derive it, but in practice the model will have built into it the low-level systematics associated with our imperfect knowledge of the IRFs and the approximations that we make regarding neglecting the finite energy resolution. However, as the diffuse emission is bright over most regions of the sky, these small imperfections may result in large systematic effects for sources. For this reason we do not recommend using diffuse emission models for analyses with event classes for which their validity has not been tested and established.
Furthermore, the templates for the isotropic spectrum include misclassified cosmic rays. The probability of such misclassifications differs between event classes as well as between event types. Therefore, it is important to use the isotropic template corresponding to the data selection. This applies both in terms of the event class and event type, i.e., if P8R3 front-converting events are selected, then the corresponding isotropic template for P8R3 front-converting events should be used. If both front-converting and back-converting events are selected then the combined template for front+back events is appropriate. We note that there was an anisotropic component in the P8R2 SOURCE class (most significant at 1-3 GeV within ∼20° of the Ecliptic/Equator compared to the poles). The additional cuts introduced by the P8R3 selection completely removed this anisotropy.
Earth Limb Emission
The residual emission from the Earth Limb is another diffuse component that contributes to the non-celestial background seen by the LAT. Although the recommended zenith angle cuts remove the majority of the Limb photons, a lower intensity residual component remains from Earth Limb photons in the tail of the PSF that survive the zenith angle selection. The residual Earth Limb emission has a very soft spectrum and is only relevant for analyses using data below 500 MeV. The spatial distribution and amplitude of this component depends on both the time period that is analyzed and the data selection (e.g. FRONT versus BACK). For long integration times (greater than a precession period) during standard survey-mode observations, the residual emission appears as two "caps" of radius ∼40° centered at the North and South celestial poles. However during ToOs and other observation modes (for instance the modified observation strategy conducted during 2013-2014) the distribution of Earth Limb emission can be quite different.
The recommended zenith angle selections for Pass 8 analysis (see the Data Preparation page for the current recommendations) have been chosen to mitigate the impact of Earth Limb contamination for source analyses that use the recommended energy threshold of 100 MeV. Although these selections do allow a measurable level of contamination from residual Earth Limb photons, it was found that this component was sufficiently small to avoid any potential bias on the measurement of source properties. Source analyses that use data below 100 MeV or analyses of large-scale diffuse emission that include data below 300 MeV may need to consider more stringent zenith angle selections or the inclusion of a model component that accounts for the residual Earth Limb emission.
GRB and Solar flare analysis
- It is recommended to use the TRANSIENT020 class to maximize the statistics for spectral analysis of GRB prompt emission since it is more or less background free due to the short duration of the GRB prompt emission. When using the TRANSIENT020 class, it is recommended to not use data below 100 MeV for spectral analysis since the instrument response is not validated in the lower energy band.
- It is recommended to use the SOURCE class to search for GRB afterglows since the TRANSIENT020 class only adds lower energy photons, which may not help given the increased backgrounds.
- It is recommended to use data above 300 MeV to localize the GRB since low energy events suffers from the so called "Fish eye" effect where the reconstructed direction points toward smaller inclination angles due to selection bias. It is also recommended to use the SOURCE class for GRB localization since the TRANSIENT020 class does not improve statistics at the high energy band.
- The recommended isotropic model to be used with the TRANSIENT020 class is tabulated in the iso_P8R3_TRANSIENT020_V2_v06.txt file.
- It is recommended to use TRANSIENT015S class for the spectral analysis of impulsive Solar flares since it has been designed to minimize the sensitivity to pile-up that can occur during X-ray Solar flares. In this case, the recommended isotropic diffuse template is tabulated in the iso_P8R3_TRANSIENT015S_V2_v06.txt file.
- It is recommended to use SOURCE class for the spectral analysis of extended emission from Solar flares since the TRANSIENT15S class has a larger background contamination and it has been found that during the long lasting emission of Solar flares the rate of X-ray fluxes are lower and do not induce pile-up in the detector.
LAT Low Energy (LLE) data product
The LAT Low Energy analysis (LLE) is a type of analysis developed by the Fermi-LAT and Fermi-GBM teams for increasing the effective area of the Large Area Telescope at low energy, and it is suitable for studying transient phenomena, such as Gamma-Ray Bursts and Solar Flares. The LLE analysis filters event data with a very loose event selection, requiring only minimal information, such as the existence of a reconstructed direction. The LLE analysis has been updated to the new Pass 8 event reconstruction and additional selection cuts have been added to reduce the contamination from cosmic-ray events. The reconstructed direction is used to select events that are compatible with a certain location in the sky, using information on the Point Spread Function to increase the signal-to-noise ratio. The instrument response is calculated with a dedicated Monte Carlo simulation that uses satellite pointing information and the celestial location of the source. The released FITS files contain the data (in various formats) and the instrument response.
The LLE data is a data product that differs from the standard LAT data products, and goes with some caveats and considerations:
- The LLE data selection and response depend on the input localization of the GRB. The default localization is taken from the Fermi GBM Trigger Catalog. Although the procedure to obtain LLE data and response is fully automatic, the update of the GBM trigger catalog is not, and this might introduce latency in the delivery of the data products with the optimized location.
- The Monte Carlo used to generate the response covers an energy range between 10 MeV and 100 GeV. At low energy (<100 MeV) the effect of the energy dispersion can be significant, and, with the current analysis, we discourage any spectral analysis below 30 MeV.
- Above a few hundred MeV (depending on the off axis angle of the event) the signal-to-noise ratio for standard data (TRANSIENT, SOURCE and cleaner event classes) is higher than for LLE data. In case of bright events with emission above a few hundred MeV we suggest using standard LAT event data at high energy and LLE data at low energy.
- The background in LLE is mainly driven by residual particle events and soft gamma-ray events in particular coming from the bright limb of the Earth. During Autonomous Repoint Requests (ARR), a significant fraction of the Earth Limb enters the LAT field of view and an increase of the event rate is clearly visible in LLE data. We urge users to exercise care in the treatment of the Earth Limb.
- Data and response are, by construction, related to each other. In case of updates, we recommend updating both the response and the data, making sure that the version number is the same.
LAT Monitored Source List
The flux estimates provided in the LAT Monitored Source List plots and tables do not include systematic uncertainties and reflect the recommended analysis and calibrations at the time the data were acquired. Therefore, use of these data as absolute flux measurements for constraining models or for comparison to other data is strongly discouraged. In addition to overall normalization uncertainties, source fluxes may have variations of up to 10%, particularly earlier in the mission, because of uncorrected dependencies of the gamma-ray detection efficiency on variations of the particle background over the orbit. See the caveats on variability studies mentioned above. Please note that these results have been produced using a variety of instrument response functions and calibrations.
Periodicity artifacts in LAT time-series analysis
Last updated by: Nestor Mirabal 10/4/2018

- Curator: J.D. Myers
- NASA Official: Elizabeth Hays
- Fermi FAQ, Comments, Feedback
- › Privacy Policy and Important Notices
- › Accessibility
- › Contact NASA
- › Page Last Updated: Mon, Sep 21, 2020