
Fermi Friday - November 09, 2018

Fermi Talks Tech: Constructing the Diffuse Interstellar Emission Maps
Posted by Guðlaugur Jóhannesson (University of Iceland, Reykjavik Iceland and NORDITA, Stockholm University and KTH, Stockholm Sweden)
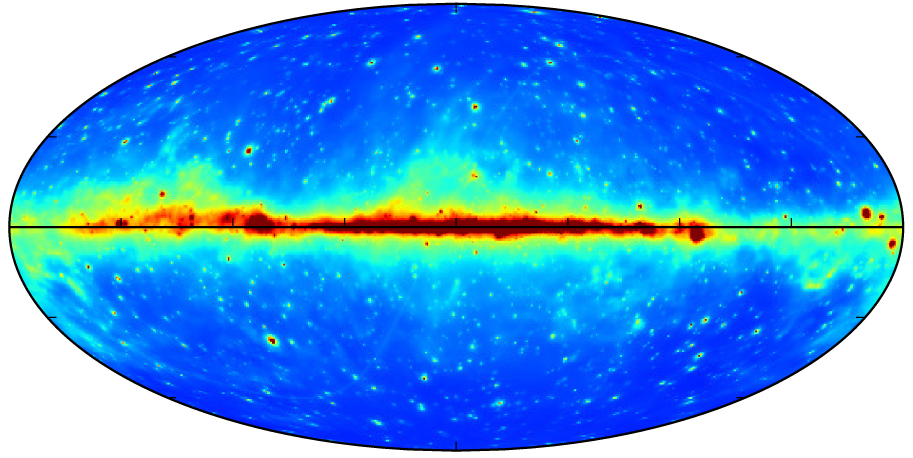
Gamma-rays from interstellar space dominates the sky viewed by Fermi Large Area Telescope (LAT). The Galaxy is almost completely transparent to photons in the LAT energy range (30 MeV to >300 GeV) and thus the observed interstellar emission is just the sum of all the photons LAT sees. The emission processes for the interstellar emission are known and depend only on the density of cosmic rays and the density of the sources, either gas or light from the stars.
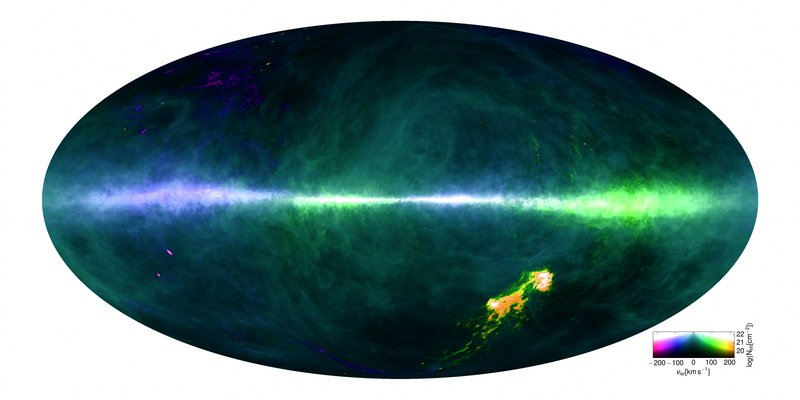
The entire sky in the light of neutral atomic hydrogen as seen by the Parkes and Effelsberg radio telescopes. The doppler shifted velocity of the line emission is color coded while the intensity represents increased column density. Image credit: the HI4PI Collaboration.
Interstellar gas can be traced by its molecular line emission observable at radio to sub-mm wavelengths. The intensity of the line emission can be used to estimate the density of interstellar gas and the observed frequency of the line can be used to estimate its distance from the Galactic center (GC) assuming the frequency is Doppler shifted due to the rotation of the gas around the GC as illustrated in below. This information is then used for each pixel in the map above to estimate the column density as a function of radial distance to the GC.
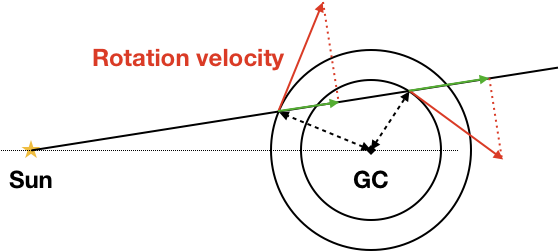
Illustration showing how the rotation velocity projected on the line of sight (green arrows) changes with distance from the GC. The effect is purely geometric and only depends on the radial distance to the GC. Credit: Guðlaugur Jóhannesson
Establishing the photon density of starlight is more difficult because the Galaxy is optically thick at those wavelengths due to interstellar dust that absorbs the light and re-emits it at longer wavelengths. The distribution of photons can thus not be directly observed but models do exist. While the models are not perfect, they do provide a reasonable estimate of the photon density in the Galaxy that is used for the interstellar emission modeling.
It is well established that the distribution of Cosmic Rays in our Galaxy is relatively smooth over distances of a few thousand light years. Their distribution is not well known and the best way to determine that is by using gamma-ray observations. When making the interstellar emission model, the distribution of Cosmic Rays is determined from a fit to the data allowing it to vary with radial distance from the GC and also with distance from the Galactic plane. The interstellar emission model is a linear combination of the target templates described above multiplied with the density of Cosmic Rays that is free to vary in the fit. A model for other gamma-ray emission components, such as point sources, is required for this to work.

This method for building the interstellar emission model has been used successfully three times to build interstellar emission models distributed for Fermi-LAT data analysis and is currently in use to build the next model. The description above is simplified to capture the main points and excluded several nuances. This method has also been applied in several smaller regions of the sky in order to study the physics of the interstellar medium.

- Curator: J.D. Myers
- NASA Official: Elizabeth Hays
- Fermi FAQ, Comments, Feedback
- › Privacy Policy and Important Notices
- › Accessibility
- › Contact NASA
- › Page Last Updated: Fri, Nov 09, 2018