
About FAVA
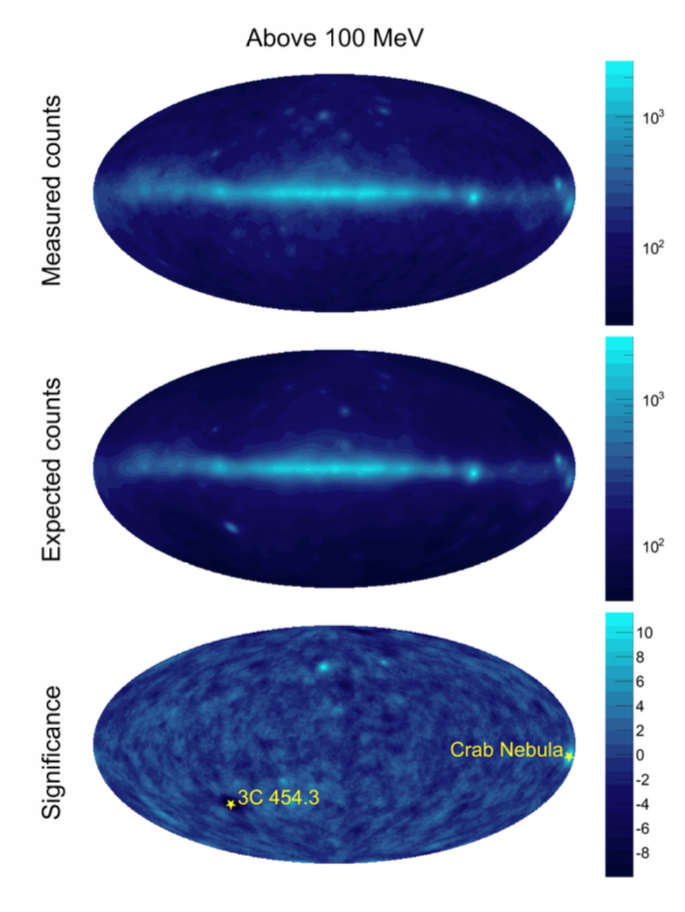
Figure 1: An illustration of the FAVA technique taken from Ackermann et al. (2013). The measured counts map is shown in the first row, expected counts from the average emission observed during the first 47 months of Fermi observations is shown in the middle row, and the third row shows the significance of the flux variations.
Motivation:
The Fermi All-sky Variability Analysis (FAVA) is a photometric analysis technique that searches for flaring sources in data collected by the Large Area Telescope (LAT) onboard NASA's Fermi Gamma-ray Space Telescope's . The FAVA analysis bins data over a grid of regions on the sky and searches for deviations from the expected flux based on the observed long-term average emission collected over the course of the Fermi mission. This photometric approach has three main advantages over a traditional likelihood analysis typically employed for the analysis of gamma-ray data. 1) The analysis is independent of any model for the diffuse gamma-ray emission. The diffuse emission is expected to be constant over the lifetime of the Fermi mission and therefore cancels out in the comparisons between number of expected and measured gamma-ray events. 2) The analysis is computationally inexpensive, allowing us to blindly search for flux variations over the entire sky and over a range of energy bands and timescales, potentially yielding unexpected discoveries. 3) No assumptions are made about the spectral shape of the gamma-ray sources as is required in a traditional likelihood analysis.
Analysis Technique:
FAVA uses the mission average emission to estimate the expected counts over a much shorter timescale. This is achieved by binning the observed emission into a grid of regions, or pixels, on the sky. Each pixel is then smoothed by assigning all events that were detected within a distance corresponding to the 68% containment radius of the LAT point-spread function (PSF) and normalized by the total exposure. If each pixel position is characterized in spherical coordinates by φ and θ, then the expected counts for a given time interval and particular pixel on the sky is calculated according to:

where ε represents the exposure of the observations. Since the PSF depends on both the photon energy E and on the incidence angle α with respect to the LAT, we integrate over these two parameters. The observed and expected rates are then compared and the difference is converted to a Poisson probability, which is in turn converted to a Gaussian σ.
Likelihood Followup:
Because FAVA is a photometric technique that bins data over a broad energy range, the analysis provides very limited spectral information of detected flares. Therefore, the location of each flare is also examined using a traditional likelihood analysis in an attempt to better characterize and associate the transient source. The FAVA detections serve as seed positions on which to perform a likelihood scan to generate a 5x5 degree test statistic (TS) map. By fixing the flux and index parameters for all known catalog sources in the region of interest, the resulting TS map can reveal the presence of both uncatalogued sources as well as sources that vary significantly above their catalog values. The localization provided by these TS maps can more accurately associate FAVA flares to known 3FGL sources, typically producing localization errors of ~0.1 deg at 95% confidence.
Analysis Details:
Averaged emission duration: 4 years
Analysis time bins: 1 week
Sky bins: 0.5 deg
Low energy bin: 100 - 800 MeV
How energy bin: 800 - 3e5 MeV
Data Selection: P8_SOURCE
IRFs: P8R3_SOURCE_V2
Low energy likelihood analysis: binned
High energy likelihood analysis: unbinned
Low energy TS map: 7x7 deg, 0.15 deg binning
High energy TS map: 3x3 deg, 0.05 deg binning
Analysis Caveats:Important!
It is important to remember that FAVA is a photometric technique. Because of the large PSF of the LAT (as much as 12° 95% containment radius at 100 MeV when using P8R3_SOURCE_V2) care must be taken in interpreting emission excesses at a particular location in the sky, as emission from a flaring source will be detected over a large region of the sky. Therefore, users of the light curve generator are encouraged to consult the accompanying flare map to check the percise location of the flare associated with any excess emission found near the user's coordiantes of interest.
Credits:
The FAVA pipeline is currently maintained by Rolf Buehler (DESY Zeuthen), Daniel Kocevski (NASA Marshall Space Flight Center), and Matteo Giomi (DESY Zeuthen), with followup activity coordinated by Marco Ajello (Clemson). The website interface was designed by Daniel Kocevski, using the D3, Highcharts, and Kartograph javascript plotting libraries, and the Bootstrap toolkit.
Further Reading:
The Fermi All-sky Variability Analysis: A List of Flaring Gamma-Ray Sources and the Search for Transients in Our Galaxy, Ackermann et al. 2013 ApJ, 771 57
The Second Catalog of Flaring Gamma-Ray Sources from the Fermi All-sky Variability Analysis, Abdollahi et al. 2017 ApJ, 846 34
An Overview of the Second FAVA Catalog, Kocevski et al. 2015, 6th Fermi Symposium, Washington, DC, Nov. 11th, 2015