

LAT Gamma-Ray Burst Analysis
This procedure provides a step-by-step example of using the X-Ray Spectral Fitting Package (XSPEC) to analyze LAT Gamma-Ray Burst observations.
Prerequisites
- gtselect
- gtbin
- gtrspgen
- Spacecraft pointing and livetime history file.
- XSPEC, used as a spectral analysis tool in step 4 of this procedure. (See Xanadu Data Analysis for X-Ray Astronomy.)
Note: LAT GRB data can also be spectrally analyzed using the likelihood tools for source analysis.
Assumptions
It is assumed that:
- You are in your work directory.
- You know the time and location of the burst you wish to analyze.
Note: For the purposes of this thread, the relevant burst properties are:
- RA = 47.907 degrees
- Dec = -11.758 degrees
- Tstart = 254033757. s (Mission Elapsed Time)
- Tstop = 254034457. s (Mission Elapsed Time)
- You have extracted the files used in this tutorial; these files can be found here. Alternatively, you could try GRB080916C, by extracting the LAT data for (RA,DEC)=(119.88,-56.59) and a time window centered on MET=243216765.
- The GRB in question is of a sufficiently short duration, e.g. ~10's of seconds, so that the accumulation of LAT background counts is negligible. In order to study delayed emission or burst of extended duration, e.g. 10's of minutes to ~hour timescales, a likelihood analysis may be required.
Steps:
- Select the LAT data.
- Bin the data.
- Create the detector response matrix (DRM).
- Run XSPEC (Linux users only).
1. Select the LAT Data
We can perform further selections of the original event file with gtselect as desired. For example:
prompt>  gtselect evclsmin=1 evclsmax=4

Input FT1 file[] LAT_090119205.fits

Output FT1 file[] GRB090119205_spec_ph.fits

RA for new search center (degrees) (0:360) [0] 47.907

Dec for new search center (degrees) (-90:90) [0] -11.758

radius of new search region (degrees) (0:180) [180] 10

start time (MET in s) (0:) [0] 254033757

end time (MET in s) (0:) [0] 254034457

lower energy limit (MeV) (0:) [30] 100

upper energy limit (MeV) (0:) [300000]

maximum zenith angle value (degrees) (0:180) [180] 105

Done.
Notes: The photons are selected from:
- A circle of radius 10 degrees around the best burst position
- The LAT's 100-300,000 MeV energy range was selected
- A duration of 700 s was selected. Most of the photons originate from the first ~6 s.
2. Bin the Data
Use gtbin to bin the photon data into spectra that XSPEC can analyze. The following is a transcript of running this tool.
prompt>  gtbin

This is gtbin version ScienceTools-v9r15p2-fssc-20090808

Type of output file (CCUBE|CMAP|LC|PHA1|PHA2) [PHA2] PHA1

Event data file name[] GRB090119205_spec_ph.fits

Output file name[] GRB090119205.pha

Spacecraft data file name[NONE] spacecraft_data_file.fits

Algorithm for defining energy bins (FILE|LIN|LOG) [LOG]

Start value for first energy bin in MeV[30] 100

Stop value for last energy bin in MeV[200000] 300000

Number of logarithmically uniform energy bins[] 30
Notes:
- The choice of pha1 for 'Type of output file' indicates that you want to create a single PHA file — the standard FITS file with binned spectra — spanning the entire time range.
- The input file created by gtselect is GRB090119205_spec_ph.fits. The output file is GRB090119205.pha (the extension .pha indicates that this is a standard PHA file). The spacecraft data file is called spacecraft_data_file.fits.
- LAT photon energies are not quantized and therefore you can choose the desired channel bins.
Here a logarithmic grid has been chosen with 30 bins between a start energy of 100 MeV and stop energy of 300,000 MeV.
3. Create the Detector Response Matrix (DRM)
A Detector Response Matrix, created as a single RSP file (i.e,. we do not split the DRM into separate RMF and ARF files), is required to analyze the .pha file with XSPEC.
The tool for the LAT is called gtrspgen, and the following is a transcript of running this tool.
prompt>  gtrspgen

This is gtrspgen version ScienceTools-v9r15p2-fssc-20090908

Response calculation method (GRB|PS) [GRB]

Spectrum file name[] GRB090119205.pha

Spacecraft data file name[] spacecraft_data_file.fits

Output file name[] GRB090119205.rsp

Time of GRB (s)[0.] 254033757

Response function to use, Handoff|DC2|DC2A|DC2FA|DC2BA|DC2FB etc[P6_V1_DIFFUSE] P6_V3_DIFFUSE

Algorithm for defining true energy bins (FILE|LIN|LOG) [LOG]

Start value for first energy bin in MeV[30.] 100

Stop value for last energy bin in MeV[200000.] 300000

Number of logarithmically uniform energy bins[100]
Notes:
- We assume that the instrument response changes as a result of the LAT's pointing on timescales longer than the burst duration.
This assumption is indicated by the choice of 'GRB' for 'Response calculation method' if our photons were selected over '700 s' because gtselect will not currently select photons over short durations. However, most of the photons are in the first ~6 s, justifying the 'GRB' choice.
- The input file is GRB090119205.pha, the PHA file we created with gtbin
The output file is GRB090119205.rsp (the .rsp extension indicates that this is a standard RSP file).
- gtrspgen reads the location of the burst and the size of the extraction region from the PHA file. However, you must input the time at which the DRM is to be calculated.
- In gtrspgen you choose the incident photon energy ('true energy') bins. gtrspgen reads the apparent photon channel energy grid from the PHA file. The DRM created by gtrspgen is the mapping from the incident photon energy bins into the apparent photon channels. These incident photon energy bins need not be the same as the channels:
- If there are only a few channels then the calculation of the expected number of photons in each channel will be more accurate if there are more incident photon energy bins.
- You might want to include some incident photon energy bins above and below the range of channels to account for the LAT's finite energy resolution. Incident energy bins above the highest channel energy is particularly important if some for the photon's energy leaks out of the detector.
4. Run XSPEC
You now have the two files necessary to analyze the burst spectrum with XSPEC:
- A PHA file with the spectrum.
- An RSP file with the DRM.
Note that there is no background file. All non-burst sources are expected to produce less than 1 photon in the extraction region during the burst! Here we provide the simplest example of fitting a spectrum with XSPEC; for further details you should consult the XSPEC manual.
- Start XSPEC.
Note: The default version is now release 12 (XSPEC12).
- Load in the data:
XSPEC12>data GRB090119205.pha - Load in the DRM:
XSPEC12>response GRB090119205.rsp - Load in a power law model
XSPEC12>model powerlaw - Choose the parameters' initial values.
Note: Power law indices tend to be near 2 for gamma-ray sources.
- Fit the data:
XSPEC12>fit - To look at the fit using energy as the x-axis, enter:
	XSPEC12>setplot energy


	XSPEC12>plot ldata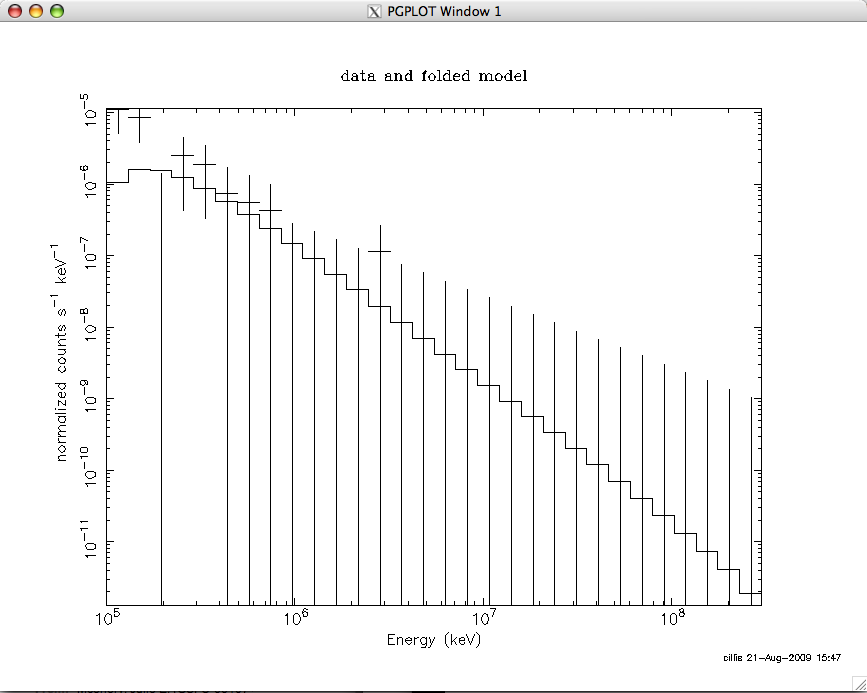
Note that you may be prompted for the lower and upper energy boundaries, which you should provide in units of kev.
Note: While this is not the appropriate place to discuss spectral fitting with XSPEC, issues to consider are:
- The number of photons in the spectrum
- The number of counts per bin (and therefore the number of bins)
- The energy range that should be fit
- The fitting statistic
Last updated by: Analia Cillis 08/21/2009