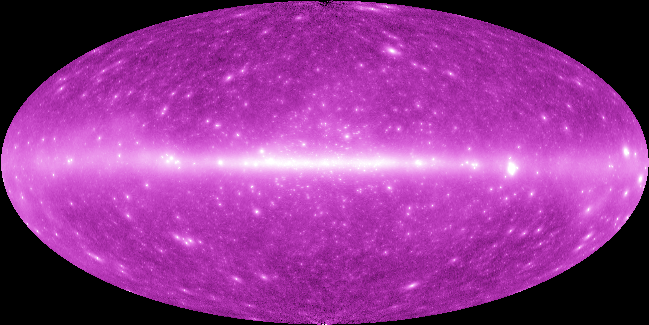
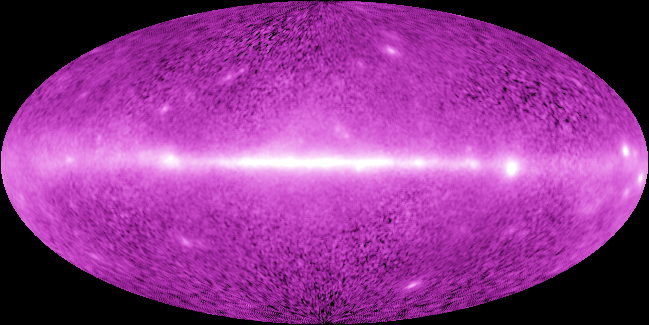
Simulated GLAST All-Sky Survey
Simulated GLAST Sky Survey (E > 100 MeV)

EGRET Data for Phases 1-5 (smoothed slightly to reduce statistical fluctuations)

Notes for the Image of a Simulated GLAST Sky Survey
The simulated image includes several components:
- A diffuse Galactic background model (Hunter et al. 1997; Sreekumar et al. 1998)
- The sources in the Third EGRET Catalog (Hartman et al. 1999, in press)
- Extended emission models for the LMC and M31, and point source models for some other normal galaxies
- Point sources for some starburst galaxies
- A Galactic halo of unidentified sources
- An additional distribution of unidentified sources about the Galactic plane
- The diffuse isotropic background represented as many faint sources with a flux distribution based on Stecker & Salamon (1996).
No resolved SNR were included in the simulation; in an all-sky map for E > 100 MeV in all likelihood they would not be distinguishable from point sources. Note several of the 3EG point sources are likely to be associated with SNR.
The simulation used parameters for GLAST that are consistent with the specifications in the GLAST Science Requirements Document. The sky survey is assumed to have been performed in "step-rocking" mode, and the resulting exposure is uniform. The off-axis variation of the effective area and the distribution of observing time with inclination angle have been factored into the exposure calculation. The exposure adopted here corresponds to 85% observing efficiency for a one-year sky survey. (For the anticenter simulation, a more optimistic 90% efficiency had been assumed.) The resulting exposure (energy-weighted for assumed E-2 spectra) is 3.18 x 1010 cm2 s. The effective PSF for the instrument was derived on the assumption of an E-2 input spectrum using just the on-axis response and all sources are assumed to have spectral index -2.
1. Diffuse Emission Model
 The underlying diffuse emission model (from Hunter et al. 1997 and Sreekumar et al. 1998) nominally has 30' angular resolution. This is narrow relative to the broad tails of the PSF for this energy range and does not appreciably affect the resulting resolution of the survey image. In addition to the broad band of emission from the outer parts of the Galactic disk, the diffuse emission also shows the Orion A&B-Mon R2 and Taurus-Auriga molecular cloud complexes.
2. 3EG Sources
 The brightest point sources are from the Third EGRET Catalog. The cataloged positions of the sources were used. In many cases, the cataloged fluxes were scaled down by a factor of 2 or more. Many of the sources were detected by EGRET in flaring states, so the cataloged entries (corresponding to the viewing period or periods for which the detection was most significant) do not represent time-averaged fluxes. Some artistic license was used in scaling the cataloged fluxes to produce an image that was visually more or less consistent with the EGRET intensity map for Phases 1 through 5.
3. Normal Galaxies
M31, M87, LMC, SMC are handled specially. Only the LMC has been detected by EGRET, for the others only upper limits for the fluxes are available. Fluxes for these galaxies were assigned to be consistent with published estimates and less than published upper limits.
| Galaxy | Flux (10-8 cm-2 s-1) |
Reference | Galactic coords (deg) |
|---|---|---|---|
| M31 | < 1.6 (use 1.0) |
Blom et al. 1998 | 121.2, -21.6 |
| M87 | 1.5 | Sreekumar et al. 1994 | 283.8, 74.5 |
| SMC | approx 1/3 LMC | Ozel & Fichtel 1988 | 302.8, -44.3 |
| LMC | 14.2 ± 2.2 | Hartman et al. 1999, in press | 280.5, -32.9 |
For M31 and the LMC, which may be resolved by GLAST, the spatial extent of the diffuse emission was approximated by scaling the IRAS 25 micron intensity to match the total expected flux before convolution with the PSF. (The SMC may be resolved at higher energies but was included as a point source here.) M33 may be detected as well at a low level, but is not included explicitly in the allsky map.
4. Starburst Galaxies
M82 and NGC 253 are included explicitly, although at -88° latitude, the latter is poorly placed for visibility in an allsky map in Galactic coordinates.
| Galaxy | Flux (10-8 cm-2 s-1) |
Reference | Galactic coords (deg) |
|---|---|---|---|
| M82 | < 5 | Sreekumar et al. 1994 | 141.4, 40.6 |
| 1.4 | Akyuz et al. 1991 | ||
| NGC 253 | < 8 | Sreekumar et al. 1994 | 141.4, 40.6 |
| 4 | Paglione et al. 1996 |
 Normal & starburst galaxy sources combined.
5. High-Latitude Unidentified Sources (above |b| = a few deg)
 From the results of Mukherjee et al. (1995), a luminosity of 0.6 x 1035 erg s-1 beamed into 1 sr was adopted as typical for the high-latitude, Galactic sources. A distribution of sources, centered about the Galactic center was generated with radial dispersion 4.0 kpc (in projection) and z-dispersion 2.0 kpc, with Rsun = 8.5 kpc. The log N-log S relation of these sources was found to match that of the |b| > 10° distribution in Ozel & Thompson (1996) when the total number of these sources was fixed at 250. Matching means that the power-law index is the same (-1.4) down to the flux where the EGRET log (N>S)-log S relation starts to level off (at about 1.5 x 10⁻⁷ cm-2 s-1, E > 100 MeV), presumably due to incompleteness. GLAST will detect all 250 of these sources, the typical minimum flux being about 10-8 cm-2 s-1, but only the 200 or so below 1.5 x 10⁻⁷ cm-2 s-1 flux are shown, representing the ones that EGRET did not detect.
6. Low-Latitude Unidentified Sources
 The density of these sources was chosen to be propotional to the intensity of the diffuse emission for |b| < 1.5°, which is presumably related to the total column density of gas and more or less related to the Pop I tracers. The total number of these sources was selected to be the same as the number actually shown at higher latitudes (see above), with flux range 10-8 cm-2 s-1 to 1.5 x 10⁻⁷ cm-2 s-1. The lower flux limit was somewhat arbitrary, but approximately corresponds to the flux of a 1035 erg s-1 (beamed into 1 sr) source observed from across the Galaxy. The number of sources was set equal to the high-latitude number because in Mukherjee et al. (1997) the number of unidentified sources at low latitudes was found to be approximately equal to the number at high latitudes. The flux distribution was chosen to be the same as well.
Another, more physically motivated approach may be to use the surface density map in Hunter et al. (1997) as a probability distribution projected into the plane, and assign z heights based on Mukherjee et al.'s finding of a 1.6° dispersion. Use 1035 erg s-1 as the luminosity, beamed into 1 sr, and derive the l, b distribution. Select the number of sources by requiring that the number of sources above the EGRET flux limit match the number of unidentified EGRET sources, then verify that approximately the correct l, b distributions are found for these sources.
7. Faint Background Sources (AGN)
 The ensemble of faint sources added to the image has with overall flux equal to the isotropic diffuse intensity (assumed to be 1.5x10⁻⁵ cm-2 s-1 sr-1). The distribution of these sources in flux was fit to the relation in Figure 2 of Stecker & Salamon (1996). The maximum flux for these background sources was set at 5x10⁻⁸ cm-2 s-1, near or below the EGRET detection threshold. The distribution was cut off at 3 x 10⁻¹⁰ cm-2 s-1 to make the background intensity equal 1.5 x 10⁻⁵ cm-2 s-1 sr-1. The overall density of background sources is about 4 per deg2, or one per 0.5° x 0.5° resolution element of the model.


