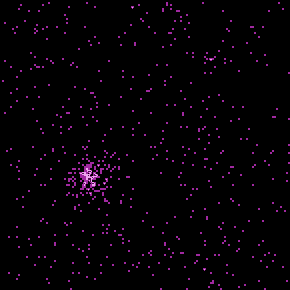
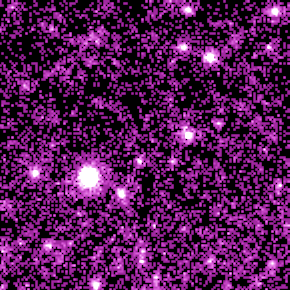
EGRET and GLAST Maps of Virgo for E > 1 GeV
|
EGRET Map of Virgo 
|
Simulated GLAST Map 
|
Notes for the Production of the Simulated Image - 16 March 1999
The region of the sky shown is l = 280°-316°, b = 50°-68° and the energy range is E > 1 GeV. The images are photon counts maps on a 0.125° grid. For EGRET Phases 1-5, the region contains 690 photons with E > 1 GeV. For GLAST, a one-year sky survey is simulated (with 85% observing efficiency), and the region contains 18600 photons (exposure approximately 3.2 x 1010 cm2s). The instrument parameters for GLAST are chosen to be consistent with the specifications in the AO Science Requirements Document for GLAST.
The components of the model are as follows:
- EGRET diffuse emission model for high latitudes (Sreekumar et al. 1998)
- 3EG catalog sources (Hartman et al. 1999, in press)
- Additional point sources at the positions of radio continuum sources in the field, with flux proportional to flux density at 1.4 GHz
- A distribution of faint sources with log N-log S relation from Stecker & Salamon (1996) that collectively have the same intensity as the isotropic background detected by EGRET
All point sources are assumed to have E-2 spectra.
1. Diffuse Emission Model
The underlying model approximately 1° angular resolution at this latitude. However, this is probably adequate for the purposes of making pretty pictures, even though the angular resolution of GLAST is much finer than this for E > 1 GeV.
2. 3EG Sources
The cataloged fluxes (for E > 100 MeV) of the sources were scaled to E > 1 GeV equivalents. The region contains eight 3EG sources.
3. Other AGN in Virgo
The assumption that every radio source is a gamma-ray source is not correct, and neither is the assumption of a proportionality between radio flux and gamma-ray flux. NRAO VLA Sky Survey sources with flux densities greater than 200 mJy were used (not including the two brightest, which appeared to be associated with 3C 273 and 3C 279). This amounts to 206 NVSS sources. The proportionality factor adopted, F(E > 1 GeV, cm-2 s-1) = 1.06 x 10⁻¹²*F(NVSS, mJy), was consistent with the findings of Mattox et al. 1997. The radio flux limit and proportionality factor were also chosen so that the overall flux from the region modeled was consistent with the EGRET observation.
4. Faint Background Sources
2439 faint background sources were included.


