

Effective Area in Pass 6
This page details the effective area parts of the instrument response for the "Pass 6" version of the LAT event selections. These correspond to the data that were released up to August of 2011. People using the the newer "Pass 7" version of the events selection should read the update version of this page.
Examples from Pass 6 V3 IRFs
The plots below show the efficiency for the Pass 6 V3 Diffuse IRF set. Note the rapid change in efficiency with decreasing energy (and with increasing cos(θ)). This has some impact on the energy binning chosen for generating exposure maps used in spectral analysis of the LAT data.
The Pass 6 V3 IRFs account for inefficiencies caused by background events with signals in the detector that overlap in time with the gamma ray events (see "Post-launch performance of the Fermi Large Area Telescope").
The effective area does not account for instrument dead time (~8%) or scheduled inactivity during SAA passages (~13%). This correction is performed by the exposure calculation.
See the LAT performance page for additional plots and commentary.
Differences between IRF versions
The effective area description in the P6_V11 IRFs include three elements not present in the earlier P6_V3 IRFs:
- A tabulation of the phi dependence of the effective area
- Extended treatment of efficiency losses induced by particle background pile-up to include variations with the orbital environment.
- Corrections the effective area tables based on observed differences of cut efficiencies between flight data and Monte Carlo simulations
The first two effects are also included more recent P7_V6 IRFs.
Corrections to the effective area tables based on flight data
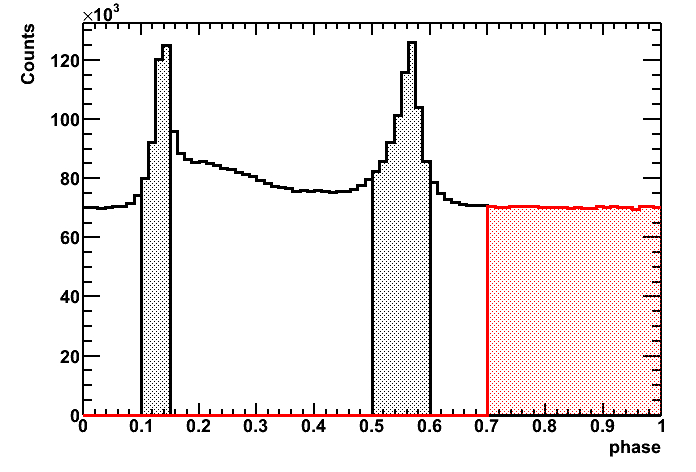
One can compare the efficiency of a particular cut on flight data relative to Monte Carlo simulations by measuring the relative size of photon signals. Although there aren't any perfect calibration sources, there are several sources where we can preform accurate background subtraction. Specifically, the LAT team used three calibration sources:
| Source: Vela pulsar Background Subtraction: phase selection Energy Range: 10 MeV - 10 GeV |
 |
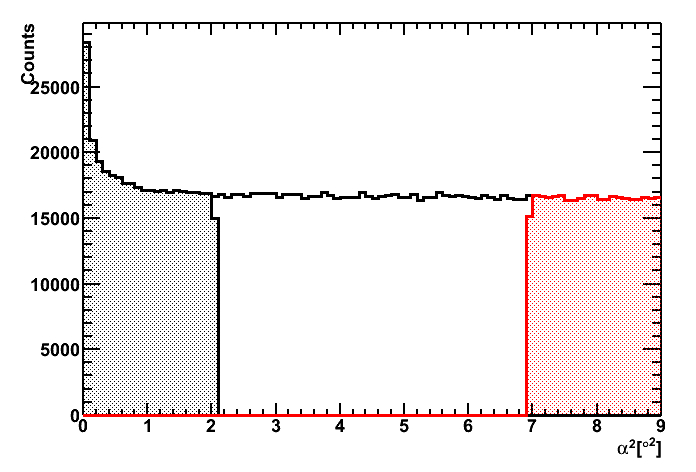
| Source: AGN sample Background Subtraction: photon direction (relative to AGN) Energy Range: 1 GeV - 100 GeV |
 |
| Source: Earth limb Background Subtraction: photon zenith angle Energy Range: > 10 GeV |
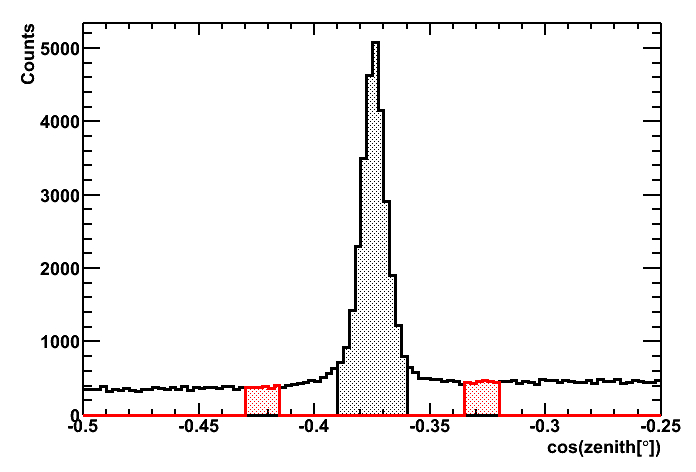 |
In each case the shaded grey region is the signal region and the shaded red region is the region used from background subtraction. In all three cases we are plotting all photons in the P6_V3_TRANSIENT event class. For Vela and the AGN sample we are using two years of data (4 August 2008 - 4 August 2010), for the earth limb we are using 200 orbits during which a large amount of the earth limb was in the LAT field of view.
We have systematically tested the agreement between flight data and Monte Carlo simulations. Although the agreement is generally excellent for most parameters, the quality of the event direction reconstruction shows a significant discrepancy. For that specific quantity, we have measured the ratio of efficiencies between flight data and Monte Carlo as a function of energy, for both front and back type events and for on-axis (cos(θ) > 0.7 and off-axis cos(θ) < 0.7. For each entry in the effective area table we do a bi-linear interpolation of the efficiency ratios R(log(E), cos(θ)) to obtain a scale factor we apply to the that value in the table.
» Forward to Energy Dispersion
» Back to the LAT PSF
» Back to the beginning of the IRFs
» Back to the beginning of the Cicerone