

Fermi LAT Aperture Photometry
LAT light curves can be created in two different ways, either by using a likelihood analysis (see the Likelihood with Python tutorial) or through aperture photometry. A likelihood analysis is the more rigorous approach and offers the potential to reach greater sensitivity. It also leads to more accurate flux measurement, as backgrounds can be modeled out and more detailed source models can be applied. However, aperture photometry can also be useful - it provides a model independent measure of the flux, requires fewer analysis steps, and is less computationally demanding.
It is assumed that prior to working through this tutorial, you already have a familiarity with the concepts in the LAT Data Preparation and Data Exploration analysis threads. The basic steps for aperture photometry are described below. Although this is straightforward, there are several steps and so it may be convenient for them to be combined together into a script.
In the example below a light curve is created centered on 3C 279. A 1-degree radius aperture is used with
an energy range of 100 to 200,000 MeV for the duration of the entire mission (START, END). In this example the photon file obtained from the LAT dataserver is:
L100903134937E0D2F37E80_PH00.fits
the spacecraft file is:
L100903134937E0D2F37E80_SC00.fits
Note: If you have downloaded your own file from the dataserver, your numbers may vary from those in the following example.
Next determine the start time of the photon file. Here we will use fkeypar, although other applications such as fv or gtvcut could be used as well.
prompt> fkeypar L100903134937E0D2F37E80_PH00.fits TSTART
Obtain this value with pget
prompt>  pget fkeypar value

239557417.
Determine the stop time of the photon file using fkeypar
prompt> fkeypar L100903134937E0D2F37E80_PH00.fits TSTOP
and obtain the value
prompt> pget fkeypar value

255142333
Select the desired event type
An output file filtered on LAT event class is then created which is used in subsequent steps. To do that you have to run the gtselect tool (see the example in the Data Preparation tutorial. With this tool you can also select events based on the aperture, energy range, and zenith distance, and output the results to a new file. The start and stop times determined above are needed for this step.
prompt> gtselect evclsmin=3 evclsmax=4 infile="L100903134937E0D2F37E80_PH00.fits"
outfile="temp_FEX3C279.fits" zmax=105 emin=100 emax=200000 ra=194.047 dec=-5.78931 rad=1
tmin=239557417 tmax=255142333
For aperture photometry we select a very small aperture (rad=1 degree), because we are not fitting the background. A tight ROI should exclude most background events and focuses on the events that are most likely to have originated from our source of interest. This data selection is significantly different from that used for likelihood analysis. Running gtselect generates a temporary file (temp_FEX3C279.fits) with the correct events selected, but without exposure corrections for that event subset.
Set the good time intervals for these selections by using gtmktime on the temporary file you created with gtselect. This uses the offset angle from the aperture and the zenith, as well as the angle of the aperture from the center of the LAT field of view to exclude times when your source is too close to the Earth's limb. gtmktime creates another output file:
prompt>  gtmktime scfile="L100903134937E0D2F37E80_SC00.fits" filter="(angsep(RA_ZENITH,DEC_ZENITH,194.047,-5.78931)+1 <105) &&
(angsep(194.047,-5.78931,RA_SCZ,DEC_SCZ)<180) && (DATA_QUAL==1)" roicut=n evfile="temp_FEX3C279.fits"
outfile="temp2_FEX3C279.fits"
The result is a new temporary file (temp2_FEX3C279.fits) with the correct events selected as well as the proper GTIs for those selections.
Create the Light Curve
Next you need to use gtbin to create the light curve with the desired time binning. In this case we have selected linear binning with a bin width (dtime) of 86400 seconds (=1 day).
prompt> gtbin algorithm=LC evfile=temp2_FEX3C279.fits outfile=lc_FEX3C279.fits scfile=L100903134937E0D2F37E80_SC00.fits tbinalg=LIN tstart=239557417 tstop=255142333 dtime=86400
This produces a binned lightcurve file: lc_FEX3C279.fits
Now you should determine the exposure for each time bin using gtexposure. This is the most computationally intensive and time consuming step, as the tool generates the exposure for each time bin and writes it to a new column in your file. In the example below, a source powerlaw index of 2.1 is used. If a more accurate spectral index is known for your source, then you should use that value instead.
prompt> gtexposure infile="lc_FEX3C279.fits" scfile="L100903134937E0D2F37E80_SC00.fits" irfs="P6_V3_DIFFUSE" srcmdl="none" specin=-2.1
You now have a light curve with counts per time bin. Note that the columns in the output file do not include a rate or a rate error column. So, in order to obtain photons/cm2/s it will be necessary to divide the COUNTS column by the EXPOSURE column. This can be accomplished, e.g. with the fv application or by using ftcalc as shown here.
prompt> ftcalc lc_FEX3C279.fits lc_FEX3C279_rate.fits RATE 'counts/exposure'

prompt> ftcalc lc_FEX3C279_rate.fits lc_FEX3C279_rate_error.fits RATE_ERROR 'error/exposure'
Here is an example light curve for 3C 279 obtained from aperture photometry. This uses a longer time range than in the example above.
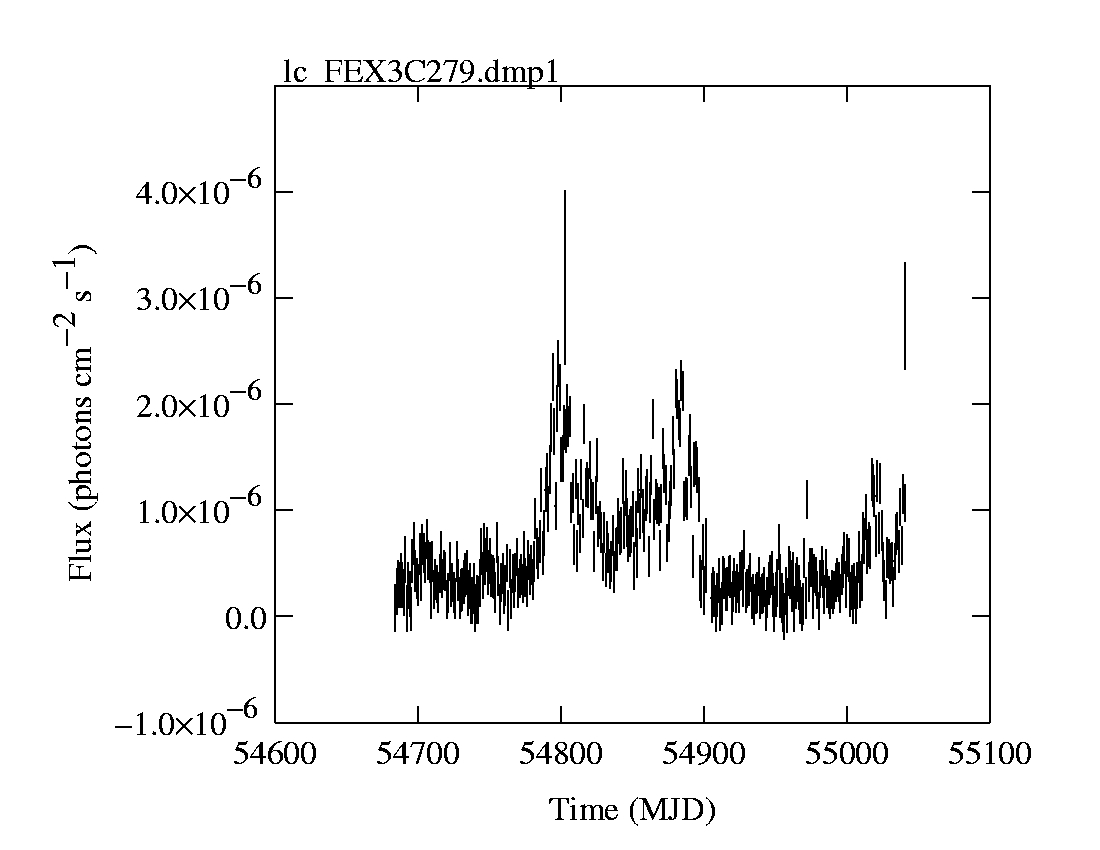
Note: The light curves obtained from aperture photometry procedure described above are NOT background subtracted. To obtain the background it will be necessary to model the sources in the region using a likelihood method. For some purposes (such as periodicity searches) background subtraction may not be necessary, and aperture photometry is appropriate.
Event Weighting
You may wish to use the gtsrcprob tool to assign probabilities to each event based on an input source model (such as the one used in the likelihood analysis. This can improve your lightcurve by increasing your acceptance radius whie selecting only events that are likely to have originated from your source.
To do this, first perform a likelihood analysis for your source for the time period that interests you. Using the output XML file from that analysis, run gtsrcprob to generate probabilities that each event may originate from each of the four modeled sources (3C 279, 3C 273, Galactic Diffuse, and Isotropic Diffuse). You may need to download the latest diffuse models prior to running gtsrcprob. All of the most up-to-date background models along with a description of the models are available here
Note: Since gtsrcprob is a function of likelihood, it should not be used as a precursor to other likelihood analyses.
prompt> gtsrcprob evfile=temp2_FEX3C279.fits scfile=L100903134937E0D2F37E80_SC00.fits outfile=temp3_FEX3C279.fits srcmdl=3C279_output_model.xml irfs=P6_V3_DIFFUSEYour output file, temp3_FEX3C279.fits now contains four new columns with the probabilities for each event. You can now filter this file and retain only events with a high probability of being from 3C 279.
prompt> ftselect temp3_FEX3C279.fits temp4_FEX3C279.fits 'src_3C_279>0.8'The resulting file can then be used as described above to create a light curve.
Last updated by: Elizabeth Ferrara 01/11/2011