
Combined LAT and GBM Analysis
This section provides the information needed to perform a spectral analyis of a Gamma-Ray Burst observation using both the LAT and GBM data and fitting those data using the X-Ray Spectral Fitting Package (Xspec).
Prerequisites
- gtbin
- gtbindef
- XSPEC, used as a spectral analysis tool in Step 2 of this procedure. (See Xanadu Data Analysis for X-Ray Astronomy.)
Assumptions
It is assumed that you have extracted the files used in this tutorial and reviewd the separate LAT and GBM burst analysis threads; these files can be found here. Alternatively, you could generate the needed files as follows.
1. Preparing the files for the spectral analysis
In the LAT Gamma-Ray Burst Analysis thread, we selected the time interval (T0, T0+40s) for the prompt emission. The GBM emission lasted longer than 40s; however, for joint analysis, the "burst" time bin must be the same time for each detector (although the "background" time bin can be different). Therefore, we will use the 40 seconds to set the GBM prompt emission time interval as well. Thus, we need to generate a new set of files for the GBM spectrum while we will use the same files generated for the LAT analysis in the LAT Gamma-Ray Burst Analysis thread.
As in the GBM Gamma-Ray Burst Analysis thread, we will use GBM detector NaI0 only but with a different set of bin definitions. Create an ASCII file called "jointTimeBins.txt":
243216736  243216756

243216766  243216806
We create the necessary file thusly:
prompt> gtbindef

This is gtbindef version ScienceTools-v9r23p1-fssc-20111006

Type of bins, E -- energy or T -- time[E] T

File containing the ascii bin definitions[] jointTimeBins.txt

Output file name[] jointTimebins.fits
prompt> gtbin

This is gtbin version ScienceTools-v9r23p1-fssc-20111006

Type of output file (CCUBE|CMAP|LC|PHA1|PHA2) [PHA2]

Event data file name[] glg_tte_n0_bn080916009_v01.fit

Output file name[] 080916C_GBM.pha

Spacecraft data file name[NONE]

Algorithm for defining time bins (FILE|LIN|SNR) [LIN] FILE

Name of the file containing the time bin definition[NONE] jointTimeBins.fits
2. Joint LAT-GBM analysis
In this tutorial, we will assign the LAT data to be the first spectrum and the GBM NaI0 data to be the second within Xspec.
1. Start XSPEC
Note: The default version is now release 12 (XSPEC12).
2. Load in the data (The GBM file is a PHA2 file; it is binned in time ("background" and "burst") as well as energy. The LAT file is a PHA1):
XSPEC12> data 080916C_LAT.pha, 080916C_GBM.pha{2}

***Warning: No TLMIN keyword value for response matrix FCHAN column.

            Will assume TLMIN = 1.


2 spectra  in use


Spectral Data File: 080916C_LAT.pha  Spectrum 1

Net count rate (cts/s) for Spectrum:1  4.919e+00 +/- 3.815e-01

 Assigned to Data Group 1 and Plot Group 1

  Noticed Channels:  1-30

  Telescope: GLAST Instrument: LAT  Channel Type: PI

  Exposure Time: 37 sec

 Using fit statistic: chi

 Using Response (RMF) File        080916C_LAT.rsp for Source 1


Spectral Data File: 080916C_GBM.pha{2}  Spectrum 2

Net count rate (cts/s) for Spectrum:2  1.738e+03 +/- 6.609e+00

 Assigned to Data Group 1 and Plot Group 2

  Noticed Channels:  1-128

  Telescope: GLAST Instrument: GBM  Channel Type: PHA

  Exposure Time: 39.79 sec

 Using fit statistic: chi

 No response loaded.


***Warning!  One or more spectra are missing responses,

               and are not suitable for fit.
Recall that for the GBM data we specified two time intervals: 1) background, and 2) burst, each with its own energy spectrum. The data come from our second bin, so that we specify 2 in brackets when we load in the data. Because the response matrix was not specified in the header of the spectral file, it has not been automatically loaded and a warning has been printed out. Load in the response matrix:
3. When inputting the response file, we use a comma to indicate that the .rsp file pertains to the second (GBM) spectrum and not the first:
XSPEC12> resp , glg_cspec_n0_bn080916009_v07.rsp

Response successfully loaded.

***Warning: No TLMIN keyword value for response matrix FCHAN column.

            Will assume TLMIN = 1.

Response successfully loaded.
4. The LAT data are sufficiently short to be background-free. When inputting the background, we use a comma to indicate that the GBM background spectrum (the first time bin) pertains to the second (GBM) spectrum:
XSPEC12> back , 080916C_GBM.pha{1}

Net count rate (cts/s) for Spectrum:2  4.751e+02 +/- 1.124e+01 (27.3 % total)
5. Another way of loading the spectra, the background, and the response files, we could have typed:
XSPEC > data 1:1 080916C_LAT.pha

XSPEC > data 1:2 080916C_GBM.pha{2}

XSPEC > back 1:2 080916C_GBM.pha{1}

XSPEC > resp 1:1 080916C_LAT.rsp

XSPEC > resp 1:2 glg_cspec_n0_bn080916009_v07.rsp
In this case we have assigned the GBM data (for a single detector) and the LAT data to a common data group (group 1) and to separate plot groups (1 for the LAT and 2 for the GBM). This can be easily generalized to incorporate multiple GBM detectors with the LAT. Note that data grouping capability also facilitates multiple GBM detector analyses or combinations of multiple GBM plus LAT analyses.
6. As explained in the GBM Gamma-Ray Burst Analysis thread, we ignore a large number of channel of spectrum 2 (GBM):
XSPEC12> ign 2:1-5,100-**

     5 channels (1,5) ignored in spectrum #     2

    29 channels (100,128) ignored in spectrum #     2
7. Next, we load a model. The "grb" or "grbm" model is the Band function:
XSPEC12> mo grb


Input parameter value, delta, min, bot, top, and max values for ...

             -1       0.01(      0.01)        -10         -3          2          5

1:grbm:alpha>

             -2       0.01(      0.02)        -10         -5          2         10

2:grbm:beta>

            300         10(         3)         10         50       1000      10000

3:grbm:tem>

              1       0.01(      0.01)          0          0      1e+24      1e+24

4:grbm:norm>


========================================================================

Model grbm<1> Source No.: 1   Active/On

Model Model Component  Parameter  Unit     Value

 par  comp

   1    1   grbm       alpha               -1.00000     +/-  0.0

   2    1   grbm       beta                -2.00000     +/-  0.0

   3    1   grbm       tem        keV      300.000      +/-  0.0

   4    1   grbm       norm                1.00000      +/-  0.0

________________________________________________________________________


 Chi-Squared =   4.514940e+06 using 124 PHA bins.

 Reduced chi-squared =       37624.50 for    120 degrees of freedom

 Null hypothesis probability =   0.000000e+00

 Current data and model not fit yet.
Fit the data:
XSPEC12> fit


<...skip output...>


========================================================================

Model grbm<1> Source No.: 1   Active/On

Model Model Component  Parameter  Unit     Value

 par  comp

   1    1   grbm       alpha               -0.883446    +/-  8.44126E-02

   2    1   grbm       beta                -2.15812     +/-  1.86103E-02

   3    1   grbm       tem        keV      287.211      +/-  66.5216

   4    1   grbm       norm                2.79570E-02  +/-  2.99392E-03

________________________________________________________________________


 Chi-Squared =         127.47 using 124 PHA bins.

 Reduced chi-squared =         1.0622 for    120 degrees of freedom

 Null hypothesis probability =   3.032310e-01
Plot the results:
XSPEC12> cpd /xs

XSPEC12> setplot energy

XSPEC12> plot uf chi

XSPEC12> iplot

XSPEC12> res y 1e-14 0.9
The last two instructions are needed to plot the LAT data, that is outside the automatic window. The figure below shows the combined spectrum obtained for this example.
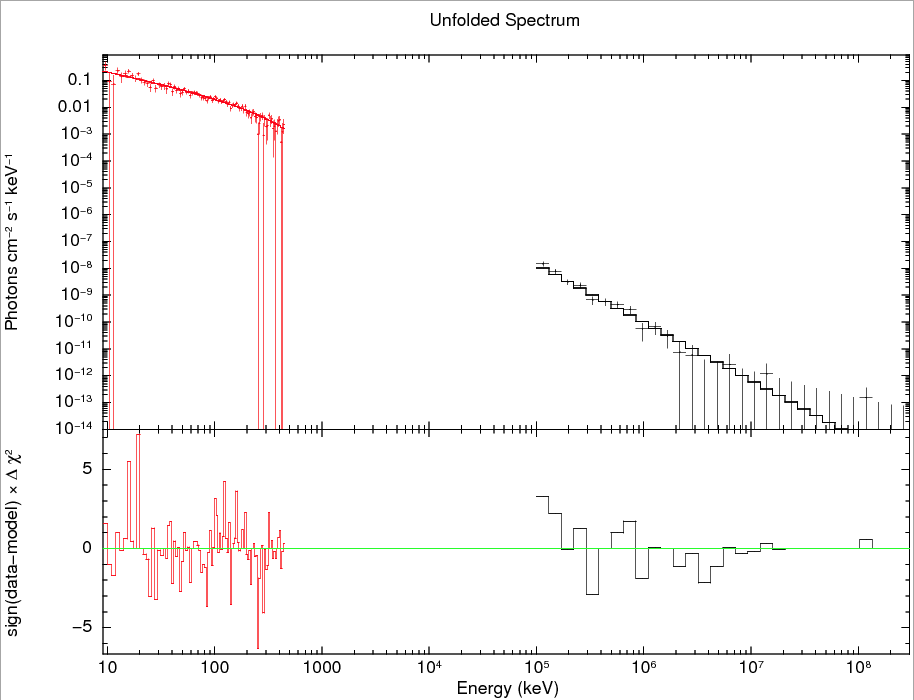
In this case the GRB spectrum is modeled up to ~3 GeV. The statistics on the GBM (10-200 keV) band could be improved by including any other illuminated NaI detectors. Also note that, for a bright GRB such as this, the coverage gap between the NaI and LAT spectra could be bridged in part by the including the appropriate GBM BGO detector.
Last updated by: Sylvia Zhu 11/11/2011

- Curator: J.D. Myers
- NASA Official: Elizabeth Hays
- Fermi FAQ, Comments, Feedback
- › Privacy Policy and Important Notices
- › Accessibility
- › Contact NASA
- › Page Last Updated: Thu, Oct 11, 2018