
Overview of GRB Spectral Analysis
The duration of the prompt burst emission—the ~100 keV component—is (relatively) short, tens of seconds at most. Therefore, the LAT's pointing does not change significantly during the burst, and all the counts can be treated as having one response function. Within a PSF radius of the burst position less than one non-burst count per minute is expected. The count rate over the FOV is ~2 Hz, the LAT's FOV is approximately 2 steradians, and the PSF has a radius of ~3.5 degrees at 100 MeV. Consequently, we expect ~0.01 Hz non-burst photons or 0.7 cts/minute within a PSF radius. Therefore, we can treat all counts within 1-2 PSF radii as burst photons.
Since a) all the counts within a PSF radius of the burst originated in the burst, and b) all the counts have the same response function, multi-source spatial analysis is unnecessary for spectral analysis of LAT data! However, spatial analysis might be necessary for localizing the burst. All the counts within a PSF radius and within a time range can be binned into a count spectrum (apparent energy is the single dimension), and traditional spectral analysis can be applied to the resulting series of LAT count spectra.
Since both the LAT and GBM data consist of lists of counts, we are free to choose the same temporal binning for burst data from both detector types, and then perform joint fits on the binned one dimensional spectra.
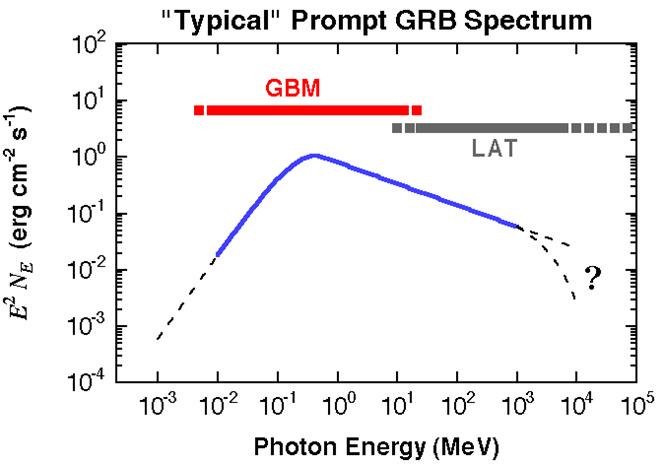
Gamma-ray burst spectral coverage of the GBM and the LAT
The afterglow will most likely produce a small number of counts accumulated over timescales of tens of minutes to hours. Thus afterglow data must be analyzed with the general likelihood tool for LAT data analysis. Here we present binned spectral analysis.
» Forward to Binned GRB Spectral Analysis
» Back to the beginning of the GRB Spectral Analysis
» Back to the beginning of the Cicerone

- Curator: J.D. Myers
- NASA Official: Elizabeth Hays
- Fermi FAQ, Comments, Feedback
- › Privacy Policy and Important Notices
- › Accessibility
- › Contact NASA
- › Page Last Updated: Mon, Nov 26, 2018