Pass 8 Analysis and Energy Dispersion
The LAT does not measure the energy of the photons with infinite precision. The finite energy resolution of the LAT called the energy dispersion has been characterized by the LAT team and this information is part of the IRFs.
For Pass 8, the energy resolution is <10% between 1 GeV and 100 GeV, which is sufficient to limit the spectral distortion to less than 5% in this energy range. Below 1 GeV the energy measurement is more difficult and the energy resolution worsens: it is ∼20% at 100 MeV and ∼28% at 30 MeV. As a consequence, ignoring energy dispersion when analyzing data below 300 MeV can induce potentially large systematic errors in the spectral fits of sources. While the energy dispersion correction reduces systematic uncertainties at all energies, the correction is particularly important below 100 MeV where the induced fractional change in the counts spectrum can easily exceed the statistical uncertainties. Therefore the LAT team strongly recommends enabling the energy dispersion correction for any analysis of data below 100 MeV.
This page describes the recommended practices for modeling energy dispersion in science analysis and the internal implementation of the energy dispersion correction in the Fermitools. For analyses that neglect the energy dispersion correction, estimates of the the induced systematic uncertainties on the spectrum of a source are provided.
How to Account for Energy Dispersion in a Spectral Analysis
The correction for energy dispersion is disabled by default when performing likelihood analysis with the Fermitools. Currently it is possible to take into account energy dispersion only in the case of a binned analysis.
By default the energy dispersion correction is applied to all components of the model. The correction may be disabled for individual components by setting apply_edisp=false in the spectrum element of that component in the XML model file. The following example demonstrates how to disable energy dispersion for the isotropic component:
<source name="iso_P8R3_SOURCE_V2_v1" type="DiffuseSource">

<spectrum file="$(FERMI_DIR)/refdata/fermi/galdiffuse/iso_P8R3_SOURCE_V2_v1.txt" type="FileFunction" apply_edisp="false">

<parameter free="1" max="1000" min="1e-05" name="Normalization" scale="1" value="1" />

</spectrum>

<spatialModel type="ConstantValue">

<parameter free="0" max="10.0" min="0.0" name="Value" scale="1.0" value="1.0"/>

</spatialModel>

</source>
We recommend that you disable the energy dispersion correction for any model components that have already been corrected for energy dispersion or were fit to the data without taking energy dispersion into account. For 4FGL data products this only applies to the isotropic template. For analysis using older diffuse models (gll_iem_v06.fits or older) the energy dispersion should also be turned off for the diffuse model, as well as any point-like or extended sources for which the spectral parameters are fixed to the 3FGL (also applies to 2FGL and 1FGL) values.
When the energy dispersion correction is enabled, the Fermitools internally add two energy bins above and below the analysis energy range when evaluating the counts model. These additional bins are used to evaluate the contribution of events with true energies outside the range of reconstructed energies used in the analysis. Depending on the chosen bin width and energy range, these two additional energy bins may not be sufficient to accurately evaluate the counts model near the edges of the energy range. It must be noted that the level of spectral distortion due to energy dispersion depends also on the source spectrum, especially in the case of sharp features (like an exponential cutoff).
Implementation of the Energy Dispersion Correction in the Fermitools
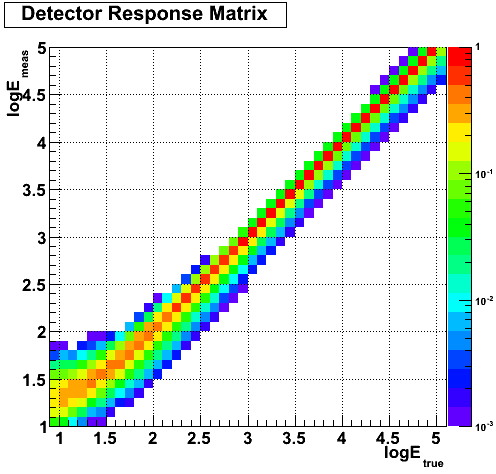
Prior to Fermitools v1.2.0, the energy dispersion correction occurs in the calculation of the model counts spectrum at each iteration of the likelihood fit. The Fermitools internally translate the energy dispersion response functions contained in the IRFs into a Detector Response Matrix, that describes how the true energies are redistributed in measured energies. For a binned analysis with n bins in logE between logEmin and logEmax, the DRM has 2 extra bins in logEtrue (one below logEmin and one above logEmax). The plot below shows an example of such a DRM in the case of a binned analysis with 40 bins between 10 MeV and 100 GeV:

For each source in the model, the energy dispersion correction is performed as follows:
- the vector vtrue of the number of predicted counts (in logEtrue bins) in the entire ROI is computed
- two additional bins (one below logEmin and one above logEmax) are added to vtrue, extrapolating the counts in the neighboring bins
- vmeas (in logEmeas bins) = DRM x vtrue
- the number of predicted counts in the pixels in energy bin i are all scaled by the factor vmeas[i]/vtrue[i]
Because of energy dispersion, the number of counts in a given bin of measured energy is the sum of counts at various true energies. In order to predict the number of counts in a given bin of measured energy, one must take into account the spectrum and the IRFs in a larger energy range than the width of the bin. That is why the Fermitools add two energy bins (one below logEmin and one above logEmax). You should keep in mind that, depending on the bin width and on the energy threshold, adding two bins might not be sufficient. For instance, in the case of 10 bins per decade, as in the DRM example above, it is necessary to take into account true energies down to logEtrue=1.8 to predict the number of counts at logEmeas=2. I.e. two extra bins below the threshold of the analysis are needed.
Starting with Fermitools v1.2.0, the energy dispersion correction in the Fermitools can take into account the interplay between the energy dispersion and PSF. The energy dispersion is controlled by a single parameter called edisp_bins:
- If edisp_bins == 0, then the energy dispersion is not applied
- If edisp is true and edisp_bins < 0, then the implementation of the energy dispersion correction only operates on the spectra, with -1*edisp_bins extra bins (-1,-2, or -3)
- If edisp is true and edisp_bins > 0, then the energy dispersion is computed by mixing in edisp_bins extra maps on either side of the energy bin in question (1,2,3,or 4). This new implementation requires substantially more computation (for each pixel we need to consider the contributions from 2n+1 energy bins, instead of just 1)
The gtdrm application estimates the energy dispersion matrix for the energy binning that you are using and can be used to evaluate the size of the effect and help you decide how many bins to use.
>>> obs = BinnedObs(srcMaps='srcmap.fits',expCube='ltcube.fits',binnedExpMap='bexpmap.fits',irfs='CALDB')

>>> conf = BinnedConfig(edisp_bins=-2)

>>> like = BinnedAnalysis(binnedData=obs,srcModel='srcmdl.xml',config=conf)
Analysis Recommendations
- Because the current Interstellar Emission Model and the 4FGL catalog were derived using a fit with energy dispersion correction switched on, all analyses using them have to also switch on energy dispersion correction. The edisp_bins parameter should be different from 0.
- Since the energy resolution varies with energy, it is important to choose an energy binning that is fine enough to capture this energy dependence. That is why we recommend a binning with 8 to 10 bins per decade.
- For most of the Fermi energy range, the level of migration in log10E due to energy dispersion is within 0.2 (when going below 100 MeV it increases up to about 0.4). As a consequence we recommend that the product of |edisp_bins| times the width of the log10E bins is at least equal to 0.2. With a binning of 8 to 10 bins per decade, it corresponds to |edisp_bins| ≥ 2. Because the edisp_bins > 0 method is still being validated, we recommend to use edisp_bins ≤ -2.
Note, any gtlike and pyLikehood analysis with edisp_bins > 0 using a source map file or exposure map file that does not include the extra energy bins will abort and give you a message explaining that you need to remake the offending file.
Systematic Uncertainties associated with neglecting energy dispersion in a spectral analysis
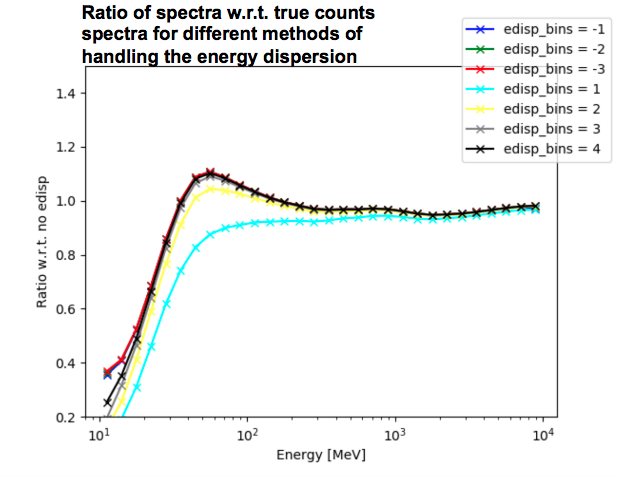
Neglecting the effect of energy dispersion introduces systematic errors in both the shape and normalization of the count spectrum. The effect of energy dispersion is relevant at energies < 300 MeV, but also induces a smaller systematic offset in the flux normalization at higher energies. The following plot shows the ratio of spectra with respect to the true counts spectra (i.e., with no energy dispersion applied) for different methods of handling the energy dispersion.

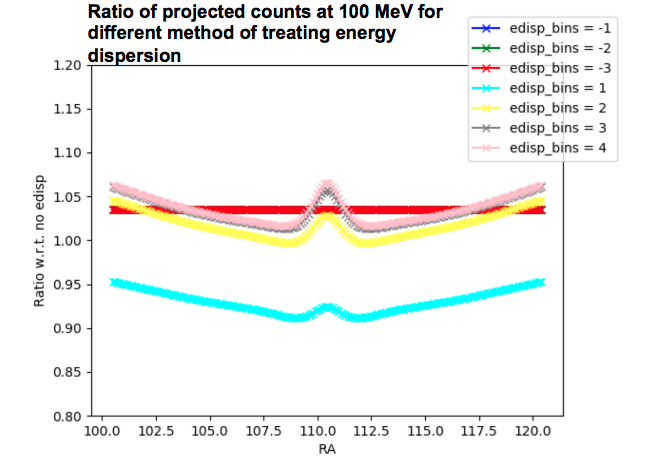
In order to attempt to visualize the effect on the effective PSF. The next plot shows the ratio of projected counts at 100 MeV for different methods of handling the energy dispersion with respect to counts with no energy dispersion applied

