Caveats About Analyzing GRB 221009A Data
Before starting data analysis, Fermi users should be aware of several important caveats with both the LAT and GBM data for this burst.
LAT
To analyze Fermi-LAT data with the standard Fermi tools, we have to first ensure that the data quality is such that the official instrument response functions (IRFs) can be used. In practice this means that the data should be taken under conditions which correspond to those for which the IRFs were designed. During the main episode of GRB 221009A, the X-ray and soft gamma-ray flux was so high that this requirement was not met. One way to see this is to look at the number of fired strips in the tracker as a function of time for the recorded events which had at least one track that passed the main gamma-ray trigger and on-board filter. This is shown in the following figure:
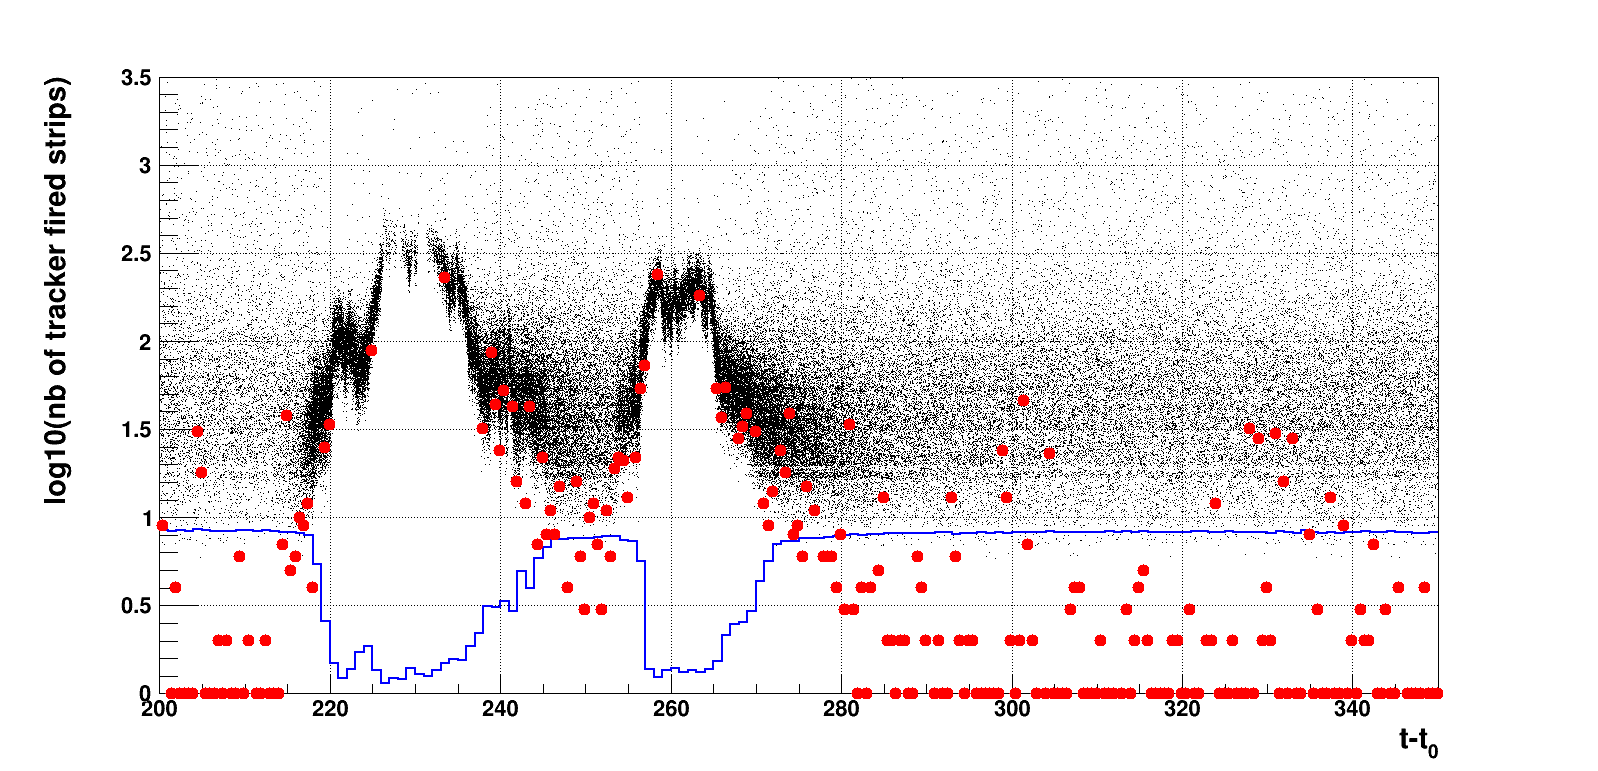
Both before (t ≲ 210) and after (t ≳ 290) the main episode of the GRB, the distribution goes down to less than 10 strips, whereas at the peak of the GRB, the minimum number of fired strips is greater than 100. The noise activity in the instrument is monitored with events that are triggered with a 2Hz cadence (the periodic trigger). This is shown with red dots in the figure. We can see that the periodic trigger events lie on the edge of the black dots distribution, showing that this edge corresponds to the noise in the instrument due to soft gamma-ray pile-up. We can also see that, because of the very high deadtime during the burst, which is a consequence of the extremely high GRB flux, the periodic trigger 2Hz cadence could not be sustained.
The number of fired strips is an important ingredient to estimate the energy of gamma rays below ∼300 MeV, for which the energy deposited in the calorimeter is low, especially for very off-axis gamma rays like those from GRB 221009A (∼75 degrees off-axis). For this GRB, the expected average number of fired strips for 30 MeV and 100 MeV photons are ∼40 and ∼70, respectively. As a consequence, the energy reconstruction is strongly impacted by the soft gamma-ray pile-up during the GRB.
This is why we have chosen to define the Bad Time Interval (BTI) as the time period during which no periodic trigger events have 0 fired strips. Because of the 30s binning of the standard spacecraft file, we end up with the interval between T0 + 203.61 seconds and T0 + 293.61 seconds. We continue to investigate how to reduce the duration of the BTI. This may require the development of a special reconstruction/selection.
We note that the signals in the instrument produced by the 99 GeV photon observed 240 seconds after the GBM trigger were well above the noise caused by the GRB-induced pile-up. Because the extra energy deposited in the instrument at that time was much less than 99 GeV, we are confident that the photon energy was well reconstructed.
For additional details, see the papers "The Large Area Telescope on the Fermi Gamma-ray Space Telescope Mission" and "The Fermi Large Area Telescope On Orbit: Event Classification, Instrument Response Functions, and Calibration".
GBM
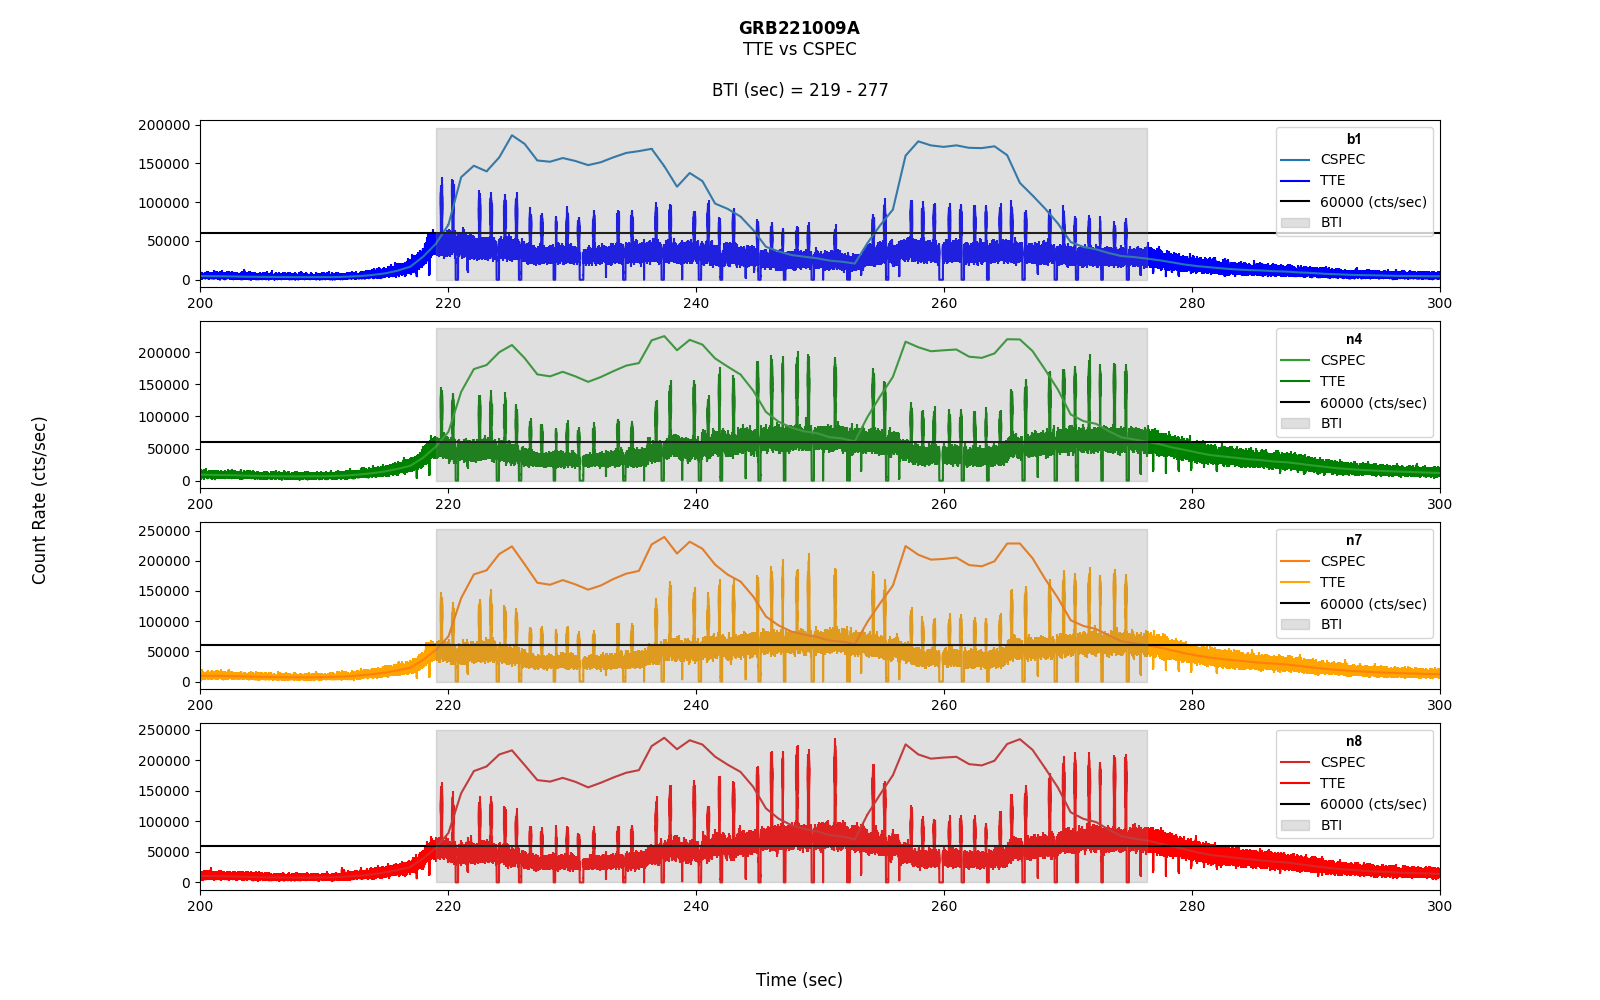
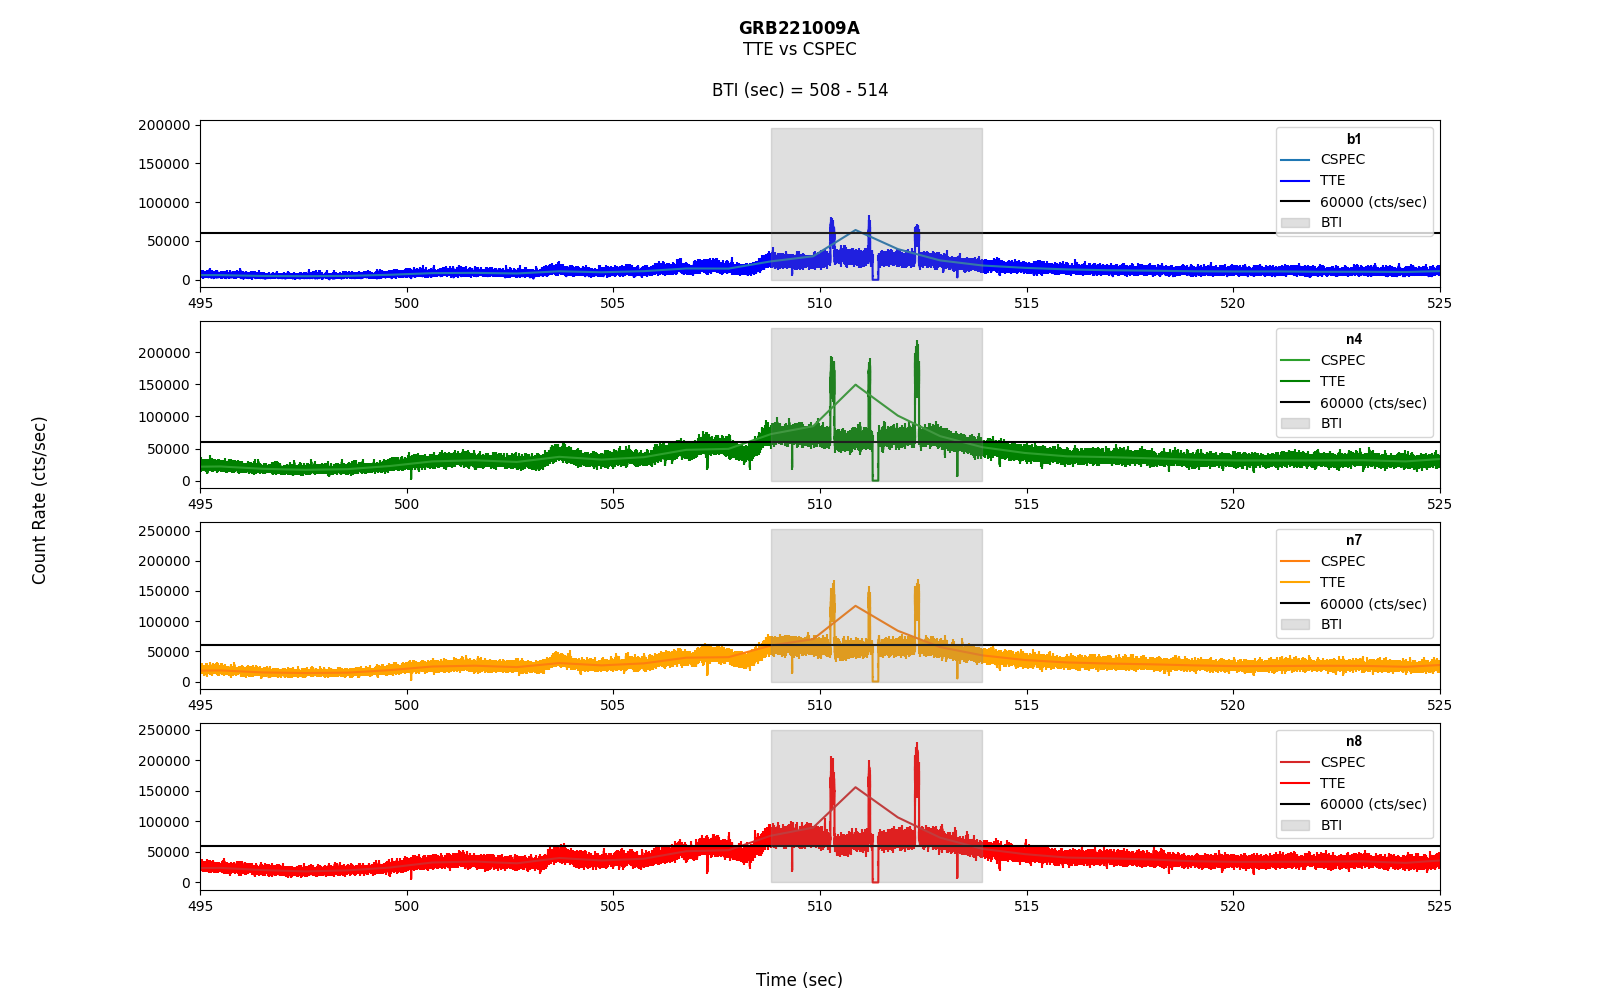
The Fermi Gamma-ray Burst Monitor data for GRB 221009A has two periods of bad time intervals, affecting all data types. At particularly high rates the TTE data has loss due to the bandwidth limit between the instrument and the spacecraft. CTIME and CSPEC data experience deadtime but do not experience similar losses due to electronics bandwidth. However, at particularly high rates both CTIME and CSPEC are affected by pulse pile-up which will strongly affect any spectral analysis. The TTE losses and CTIME and CSPEC pulse pile-up occur during similar time intervals for this burst, in the intervals of 219 to 277 seconds and 508 to 514 seconds, with T0 referenced to the GBM trigger time. We recommend exclusion of these time intervals for GBM analysis of this burst, as well as caution in using bins adjacent to these selections.