Periodicity Test (gtptest) Tutorial
The gtptest tool applies all the statistical tests available with gtpsearch application to a series of pulse phase values stored in given event files. Supported statistical tests includes Chi-squared (X2), Z-squared-n ( Z2N), H, and Rayleigh (Z2N with N == 1).
Known Issues: When running gtptest multiple times using the GUI, plot windows from previous runs reappear after they are closed manually. Thus, there is no way to permanently close plot windows without exiting the GUI.
Prerequisites
- An event or photon data file. (See Extract LAT Data.)
Sample Files. To try the examples in this section, you can download the following simulated data files. The simulated data is for demonstration purposes and the simulated pulsar is slightly brighter than the Vela pulsar. For more information, see the parameters used for the simulation.
- fakepulsar_event_phase.fits (372 kB) (Parameters Used)
Note: The output of gtptest consists of text describing the result of the periodicity tests and an optional plot. This tool also creates an output file when requested. The output file contains the result of computation, i.e., the periodicity test result in the text output and the data array to plot, for future reference.
Also see:
| Tutorial | Fermitools References |
|---|---|
| Pulsar Analysis Tutorial: Calculate Pulse Phase for Each Photon | gtpsearch |
| Pulse Phase Calculation | gtpphase |
| Binary Orbital Phase Calculation | gtophase |
How To Perform Periodicity Tests
The example below shows how to perform periodicity tests on an event file that has been processed by the gtpphase application, where a pulse phase has already been assigned to each photon and is stored in a default FITS column (PULSE_PHASE column).
The command shown below produces the following output message that describes the types and the parameters of the periodicity tests that are perormed, and explains the test results.
prompt> gtptest
Event data file name[] fakepulsar_event_phase.fits
Output FITS file name (NONE for no FITS output)[] gtptest_example_1.fits
Number of phase bins for Chi2 test[10] 10
Number of harmonics for Z2n test[10] 10
Maximum number of harmonics for H test[10] 10
Type of test: Chi-squared Test, 10 phase bins
Probability distribution: Chi-squared, 9 degrees of freedom
Test Statistic: 460.197674418605
Chance Probability Range: (1.89232561509064e-93, 1.89251484768431e-93)
Type of test: Rayleigh Test
Probability distribution: Chi-squared, 2 degrees of freedom
Test Statistic: 467.086401186073
Chance Probability Range: (0, 2.00883927982452e-99)
Type of test: Z2n Test, 10 harmonics
Probability distribution: Chi-squared, 20 degrees of freedom
Test Statistic: 490.414131212429
Chance Probability Range: (2.95186469095954e-91, 2.95215987880345e-91)
Type of test: H Test, 10 maximum harmonics
Probability distribution: H Test-specific
Test Statistic: 469.571299290169
Chance Probability Range: (0, 4e-08)
Warning in <TClass::TClass>: no dictionary for class st_graph::IFrame is available
prompt>
A plot will also be produced which is similar to the following plot.
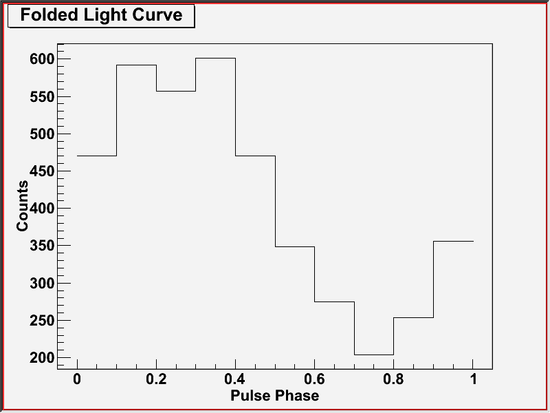
This plot shows a folded-light curve used in the chi-squared test. In this example, the folded-light curve looks sinusoidal, which is consistent with a pulse profile of the simulated pulsar.
Last updated: 11/09/2017