
Binary Orbital Phase Calculation (gtophase) Tutorial
The gtophase tool's purpose is to assign an orbital phase to each record in an event file, based on one or more known pulsar ephemerides.
Prerequisites
- Event data file in FT1 format a.k.a. a photon data file. (See Extract LAT Data).
- Orbit file to use for the barycentric correction
- Pulsar ephemeris database file which contains binary orbital parameters of a pulsar of interest
- Right Ascension (R.A.) and Declination (Dec) of the source (pulsar) location for the barycentric correction
Sample Files. To try the examples in this section, you can download the following simulated data files. The simulated data is for demonstration purposes and the simulated pulsar is slightly brighter than the Vela pulsar. For more information, see the parameters used for the simulation.
- fakepulsar_event.fits (372 kB) (Parameters Used)
- simscdata_1week.fits (2.5 MB)
- bogus_pulsardb.fits (256 kB)
Note: Like gtpphase, this tool operates on files in place. The event file processed by gtophase will be identical to:
- fakepulsar_event_orbital.fits (408 kB)
which is also available for download for your comparison.
Also see:
| Tutorial | SciTools References |
|---|---|
| Pulsar Analysis Tutorial: Calculate Pulse Phase for Each Photon | gtpsearch |
| Period Search Tutorial | gtpphase |
| Pulse Phase Calculation | gtophase |
How To Assign Orbital Phases
The tool automatically extracts one or more ephemerides from an existing pulsar ephemerides database file. Unlike the similar tool gtpphase, there is no option for entering orbital ephemerides manually. This tool does not produce a separate output file, but operates directly on the input file in place. If execution is successful, the tool produces no textual output.
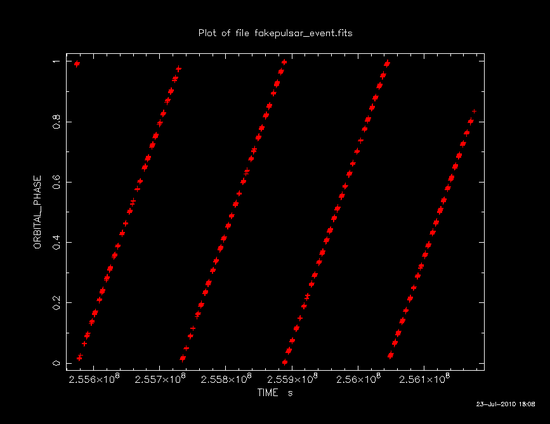
The following plot of the modified events file was produced by fplot, and shows the ORBITAL_PHASE column as a function of TIME in the events file.
Getting More Information on Computation
If gtophase is invoked with chatter parameter set to 4 or larger, it will display brief summaries of loaded ephemerides, arrival time corrections, and time systems being used. This feature shows you additional information on computations being performed, which may help you understand the tool. Also, the extra information printed may contain a clue to diagnose certain types of problem. So, try a high chatter when you are unsure on the tool's behavior.
Last updated by: Masaharu Hirayama 08/24/2009

- Curator: J.D. Myers
- NASA Official: Elizabeth Hays
- Fermi FAQ, Comments, Feedback
- › Privacy Policy and Important Notices
- › Accessibility
- › Contact NASA
- › Page Last Updated: Wed, Sep 17, 2025