

Periodicity Test (gtptest) Tutorial
The gtptest tool applies all the statistical tests available with gtpsearch application to a series of pulse phase values stored in given event files. Supported statistical tests includes Chi-squared (X2), Z-squared-n ( Z2N), H, and Rayleigh (Z2N with N == 1).
Known Issues: When running gtptest multiple times using the GUI, plot windows from previous runs reappear after they are closed manually. Thus, there is no way to permanently close plot windows without exiting the GUI.
Prerequisites
- An event or photon data file. (See Extract LAT Data.)
Sample Files. To try the examples in this section, you can download the following simulated data files. The simulated data is for demonstration purposes and the simulated pulsar is slightly brighter than the Vela pulsar. For more information, see the parameters used for the simulation.
- fakepulsar_event_phase.fits (372 kB) (Parameters Used)
Note: The output of gtptest consists of text describing the result of the periodicity tests and an optional plot. This tool also creates an output file when requested. The output file contains the result of computation, i.e., the periodicity test result in the text output and the data array to plot, for future reference.
Also see:
| Tutorial | SciTools References |
|---|---|
| Pulsar Analysis Tutorial: Calculate Pulse Phase for Each Photon | gtpsearch |
| Pulse Phase Calculation | gtpphase |
| Binary Orbital Phase Calculation | gtophase |
How To Perform Periodicity Tests
The example below shows how to perform periodicity tests on an event file that has been processed by gtpphase application, where a pulse phase has already been assigned to each photon and is stored in a default FITS column (PULSE_PHASE column).
The command shown below produces the following output message that describes the types and the parameters of the periodicity tests that are perormed, and explains the test results.
A plot will also be produced which is similar to the following plot.
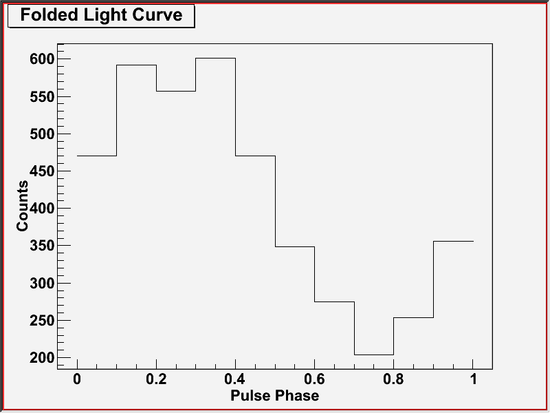
This plot shows a folded-light curve used in the chi-squared test. In this example, the folded-light curve looks sinusoidal, which is consistent with a pulse profile of the simulated pulsar.
Getting More Information on Computation
If gtptest is invoked with chatter parameter set to 4 or larger, it will display descriptions of test conditions and test results. This feature shows you additional information on computations being performed, which may help you understand the tool. Also, the extra information printed may contain a clue to diagnose certain types of problem. So, try a high chatter when you are unsure on the tool's behavior.
Last updated by: Masaharu Hirayama 08/24/2009