
LAT Sensitivity
The point source sensitivity can be calculated from the LAT IRFs.
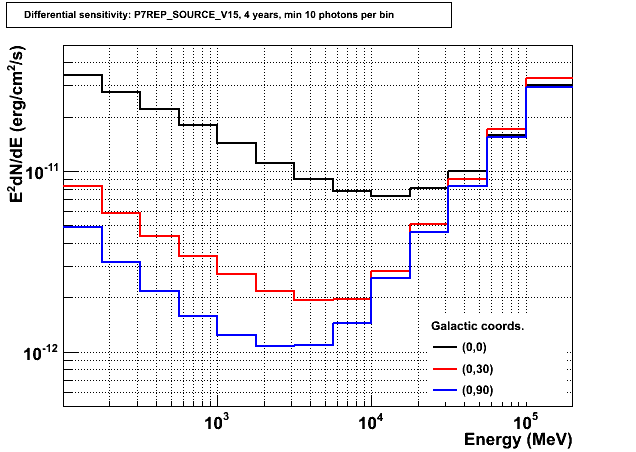
Differential Sensitivity
First we show the 5-sigma sensitivity to a high-latitude source whose spectrum is integrated over 1/4 decade in energy centered on the energy shown on the horizontal axis. Sensitivity is defined as the flux such that the log of the expected likelihood ratio for detection is 25 (or 5 sigma in the Gaussian case) and at least 5 photons. Thus, this plot shows the point source sensitivity using only the photons in each energy bin separately.
The assumptions are:
- One calendar year all-sky survey (including effects of the SAA and deadtime)
- Diffuse background flux 1.5x10⁻⁵/cm2/s/sr (E>100 MeV); spectral index -2.1
Integral Sensitivity
The point source sensitivity using the information in all energy bins is much better than the individual energy bin sensitivities above. We therefore provide the integral sensitivity measures in several ways.
Fitted Sensitivity
First the bowtie plot, which shows the minimum needed for a 20% determination of the flux after a one-day, one-month, and one-year of operation in all-sky survey for a 1/E2 source. The resulting significance at each of these levels is about 8-sigma; the spectral index is determined to about 6%; and the bowtie shape indicates the energy range that contributes the most to the sensitivity. To make a measurement at that level or better, a flat spectral energy density curve must lie above the axis of the bowtie.
Sensitivity Sky Map
There are significant variations of the sensitivity in the sky due to the spatial structure in the diffuse galactic gamma-ray background. These are summarized in the map below, which shows the sensitivity across the sky (Flux [E>100 MeV] in ph cm-2 s-1) in Galactic coordinates. (This map assumes a Test Statistic threshold of 25 for a source with a photon index of 2.0, and was generated using the P7REP IRFs.)
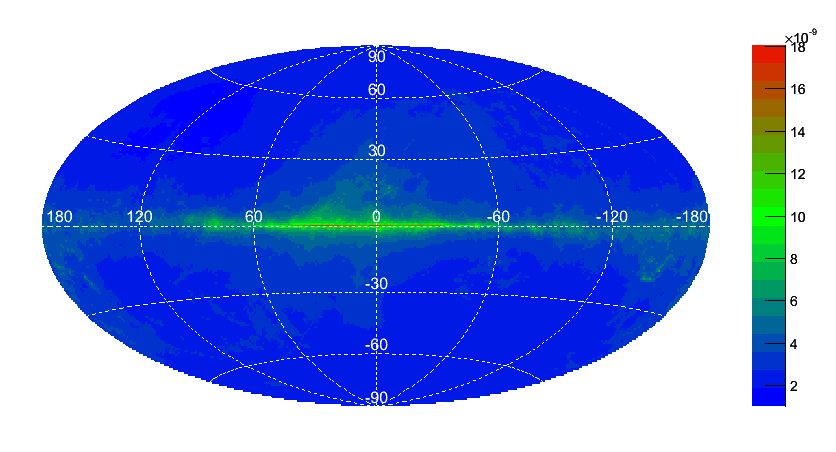
Aitoff projection of the sensitivity map for the 24-month LAT data set (shown in galactic coordinates)
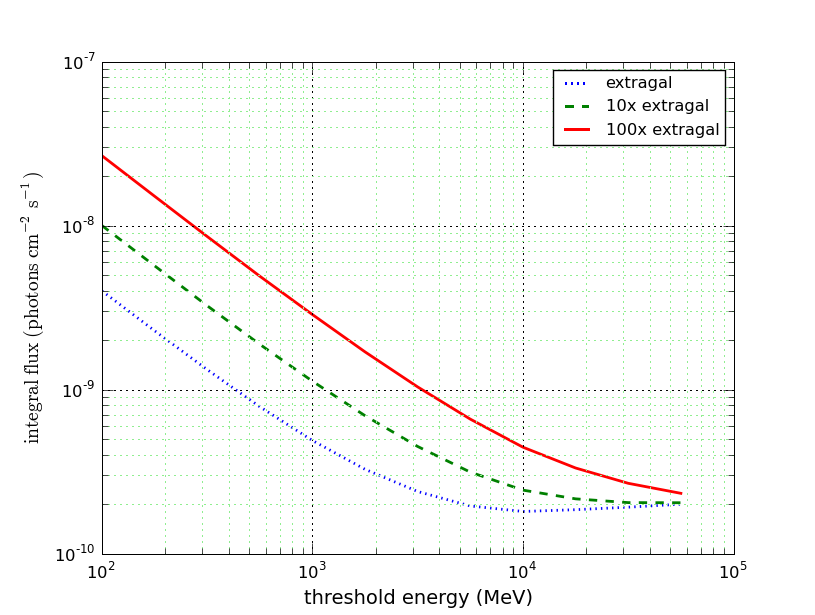
Integral Sensitivity
Finally, experiments are often compared using an integral sensitivity plot (5-sigma sensitivity for E>E0), assuming a 1/E2 spectrum source at high latitude. We show here an update for the Fermi LAT:
» Forward to Data Exploration
» Back to Energy Dispersion
» Back to the beginning of the IRFs
» Back to the beginning of the Cicerone

- Curator: J.D. Myers
- NASA Official: Elizabeth Hays
- Fermi FAQ, Comments, Feedback
- › Privacy Policy and Important Notices
- › Accessibility
- › Contact NASA
- › Page Last Updated: Thu, Jul 31, 2025