
The Point Spread Function (PSF)
The point spread function for the LAT is a function of an incident photon's energy and inclination angle, and the event class. Futhermore, the PSF is defined in terms of a scaled-angular deviation:
Where  is the reconstructed direction and
  is the true direction of the photon.
The scale factor describes the first order variation of the PSF with energy, namely that at lower energies the PSF is dominated by multiple scattering, improves with energy, and at high energies is dominated by the spatial resolution of the LAT Silicon Tracker. If E is expressed in MeV, the scale factor is:
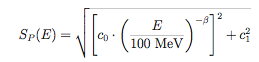
Parameters c0 and c1 have distinct values for Front and Back converting events, while β is shared between front and back. All of these parameters are stored in the PSF fits file that is part of the IRFs, in the PSF_SCALING_PARAMS table.
In-Flight PSF and Monte Carlo PSF
For some time, the LAT team has been reporting that the Monte Carlo simulations underestimated the PSF at energies of a few GeV and above. Accordingly they have developed a technique to characterize the PSF using flight data, a short summary of this technique is provided below.
For the P7_V6 IRFs, the in-flight PSF was fit independently of the Monte Carlo PSF. Because of the limited statistics, it was not possible to extract seperate parameters for the different incidence angles, so the in-flight P7_V6 PSF was the average over all incidence angles.
In contrast, for the P7REP_V15 IRFs, the LAT team developed a technique of starting with the Monte Carlo PSF, and then refitting the energy scaling behavior to arrive at the in-flight PSF. By doing this the retained the incidence angle dependence of the PSF.
PSF Fitting Method
Once the overall energy scaling has been accounted for, additional variations in the PSF are defined for a default binning of 4 energy bins per decade, from 1.25 to 6.25 in logarithmic true (as opposed to reconstruced) energy, 8 angle bins, equally spaced from 0.2 to 1.0 in cos(θMC). For each bin, the scaled angular deviation is calculated as described above.
The functional form of the analytical description of the LAT's Point Spread Function is derived and adapted from XMM's (usually described as a "King" function). The function is:
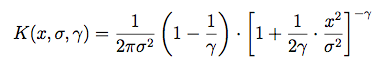
Note that this is normalized to 1 when integrated from 0 to infinity, and that the integral includes a extra factor of 2πx, because it is performed over solid angle.
To allow for a tail in the distribution we allow for the possibilty to have two King functions with different parameters:

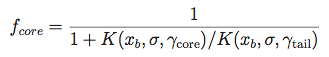
The sigmas and gammas are stored in the PSF FITS table as SCORE,STAIL,GCORE,GTAIL. Because of the arbitrary normalization used in fitting the PSF function, fcore must be extracted from NTAIL and the other parameters. NCORE is an arbitrary overall normalization factor.
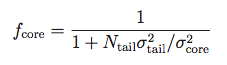
Note also that the in-flight versions of the PSF provided in the P7_V6 IRFs used a single King function, so for those fcore is simply 1.
Note that the earlier P6_V3 IRFs used a slightly different scheme. In that schema the two sigma values were equal and stored as SIGMA in the FITS table. The fraction of events in the King function describing the tail was fixed by matching the components at xb = sqrt(20) * σ.
Derivation of the Monte Carlo PSF
The Monte Carlo versions of the PSF are derived by first constructing a histogram of the scaled angular deviation for each bin in logarithmic Monte Carlo energy and cos(θMC). Here is an example of such a histogram for the bin centered at 7.5 GeV, and 30 degress for front-converting events.
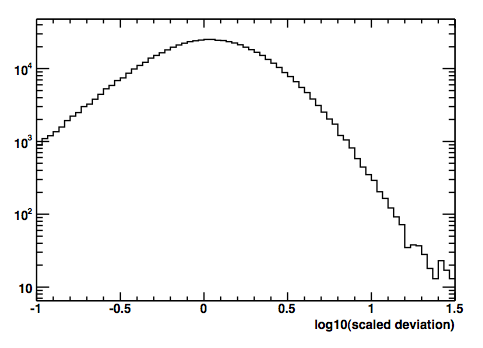
The next step of the process is to remove the extra factor of x (or r) from the solid angle integral by converting this histogram to a density histogram by dividing the contents of each bin by the bin width. In fact, a short cut is to divide by the bin center, since that is proportional to the bin width for a logarithmic scale, and the normalization is arbitrary. The resulting density histogram is then fit to extract the PSF parameters for that bin
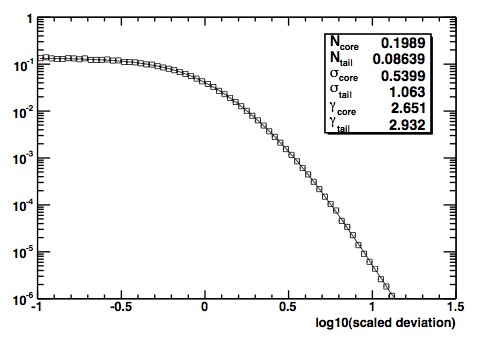
The PSF parameters for each of the bins are stored in the "RPSF" FITS table.
Derivation of the In-Flight PSF
The in-flight versions of the PSF are derived using bright point sources in the flight data, and generated for SOURCE and cleaner event classes.
At the lower end of the interval (above 1 GeV) the analysis is based on the Vela pulsar, at the higher end of the interval it is based on a stacking analysis of a suitable sample of bright AGNs.
To derive the in-flight PSF, the energy scaling parameters c0 and c1 are refit (beta is fixed to 0.8) to the flight data, and using the King function parameters tabulated from the Monte Carlo PSF. In this way the angular dependence of the PSF is preserved, while also accounting for the discrepency between flight data and Monte Carlo simulations.
| c0 front | c1 front | c0 back | c1 back | beta | version | |
|---|---|---|---|---|---|---|
| P7REP_TRANSIENT_V15 | 5.80e-2 | 3.77e-4 | 9.60e-2 | 1.30e-3 | 0.80 | Monte Carlo |
| P7REP_SOURCE_V15 | 5.56e-2 | 5.96e-4 | 9.31e-2 | 1.62e-3 | 0.80 | In-Flight |
| P7REP_CLEAN_V15 | 5.53e-2 | 5.90e-4 | 9.29e-2 | 1.68e-3 | 0.80 | In-Flight |
| P7REP_ULTRACLEAN_V15 | 5.53e-2 | 5.90e-4 | 9.29e-2 | 1.68e-3 | 0.80 | In-Flight (Same as CLEAN) |
» Forward to Effective Area
» Back to the LAT IRF Overview
» Back to the beginning of the IRFs
» Back to the beginning of the Cicerone

- Curator: J.D. Myers
- NASA Official: Elizabeth Hays
- Fermi FAQ, Comments, Feedback
- › Privacy Policy and Important Notices
- › Accessibility
- › Contact NASA
- › Page Last Updated: Wed, Sep 17, 2025