
Pulsation Search (gtpspec) Tutorial
The gtpspec tool searches for pulsations in a wider range of frequencies, using the Discrete Fast Fourier Transfer (FFT) technique to compute power spectrum density. It can be used as a part of a so-called blind period search, in which data are examined for pulsations at any frequency.
Known Issues: When running gtpspec multiple times using the GUI, plot windows from previous runs reappear after they are closed manually. Thus, there is no way to permanently close plot windows without exiting the GUI.
Prerequisites
- Event data file in FT1 format, also known as a photon data file. (See Extract LAT Data.)
- Orbit file to use for the barycentric correction
- Pulsar ephemeris database file which contains binary orbital parameters of a pulsar of interest
Sample Files. To try the examples in this section, you can download the following simulated data files. The simulated data is for demonstration purposes and the simulated pulsar is slightly brighter than the Vela pulsar. For more information, see the parameters used for the simulation.
- fakepulsar_event.fits (372 kB) (Parameters Used)
- simscdata_1week.fits (2.5 MB)
- bogus_pulsardb.fits (256 kB)
Note: The output of gtpspec consists of text describing the result of the pulsation search and an optional plot. This tool also creates an output file when requested. The output file contains the result of computation, i.e., the search result in the text output and the data array to plot, for future reference.
Also see:
| Tutorial | SciTools References |
|---|---|
| Pulsar Analysis Tutorial: Calculate Pulse Phase for Each Photon | gtpsearch |
| Pulse Phase Calculation | gtpphase |
| Binary Orbital Phase Calculation | gtophase |
How To Perform A Simple Search
Assuming No Frequency Variations
The example below shows how to perform a pulsation search in the simplest case, where one can assume no significant frequency variations exist throughout the observation. The time origin of this search is taken to be the center of the observation. That means, if a pulsation is found, the pulse frequency should be interpreted as measured at the center of the observation (i.e., the time origin).
The command shown below produces the following output message that describes the search criteria and explains the search result.
A plot will also be produced which is similar to the following plot.
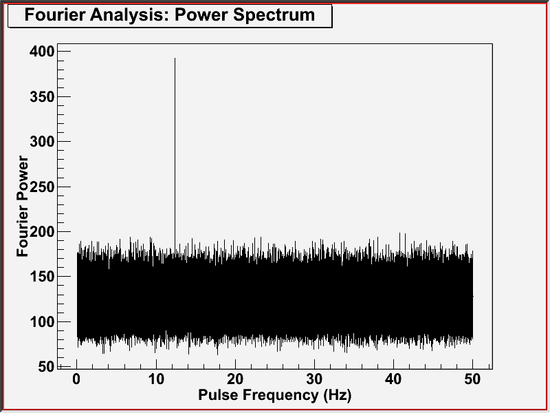
This plot very likely shows a pulsation consistent with the ephemeris of the simulated pulsar.
Correcting For Frequency Variations
In a full blind search for pulsations, it may be desired that a time derivative of pulse frequency is also scanned. This tool does not directly perform such a full search, but it supports frequency derivatives in a pulsation search. The gtpspec tool corrects for variations in the frequency, taking one set of frequency derivatives at a time. For the example below, the frequency derivatives were taken from the Monte Carlo truth of the simulated pulsar.
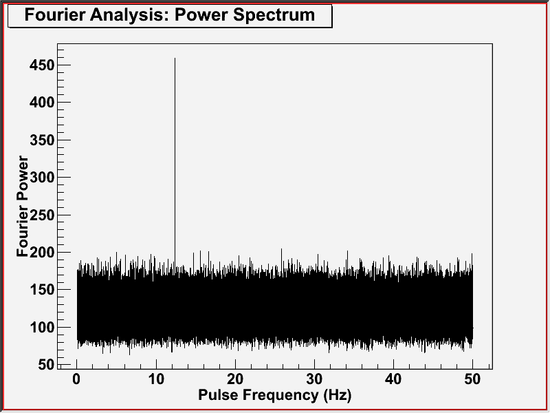
The effect of correcting for frequency variation was to increase the value of the maximum statistic, or the height of the main peak.
Getting More Information on Computation
If gtpspec is invoked with chatter parameter set to 4 or larger, it will display brief summaries of loaded ephemerides, arrival time corrections, and time systems being used, followed by a description of test condition and test result. This feature shows you additional information on computations being performed, which may help you understand the tool. Also, the extra information printed may contain a clue to diagnose certain types of problem. So, try a high chatter when you are unsure on the tool's behavior. Note that in the following example screen shot, the middle part of periodgram data is omitted.
Going Beyond The Simple Case
How To Perform A Full Pulsation Search
When searching for a pulsation, one may need to take into account time derivatives of pulse frequency that are also unknown. By running gtpspec multiple times with different sets of frequency derivatives, one can sweep a desired range of frequency and its derivatives, to perform a full blind search for pulsations in a range of pulse frequencies of interest. Note that a chance probability in a text output is for a given set of frequency parameters only. When running gtpspec multiple times, the chance probability of the entire pulsation search must be computed separately using the information shown in the text output, such as the number of independent trials and the maximum statistic.
Working In The Period Domain
The examples above all used inputs in the form of frequencies, and derivatives of frequencies. It is also possible to enter the input data as periods and derivatives of periods. These values are immediately converted to the frequency domain, and the search is still performed in the frequency domain. To enter period information instead, select PER for the ephemeris style. For example, the following input should produce the same plot as the example Correcting For Frequency Variations.
Last updated by: Masaharu Hirayama 08/24/2009

- Curator: J.D. Myers
- NASA Official: Elizabeth Hays
- Fermi FAQ, Comments, Feedback
- › Privacy Policy and Important Notices
- › Accessibility
- › Contact NASA
- › Page Last Updated: Wed, Sep 17, 2025