Count Maps
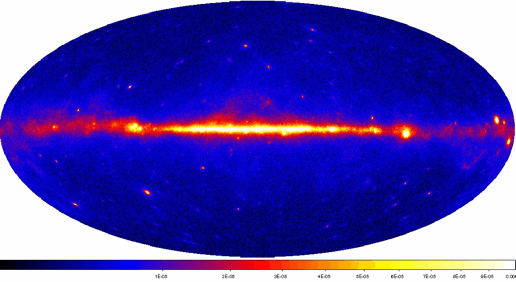
Here we want to create binned count maps for LAT data, the number of counts in spatial pixels. The gtbin tool can provide a count map in one energy band (the 'CMAP' option) or multiple energy bands (the 'CCUBE' option). The CMAP option bins all events in the event file, and therefore the energy band must be selected in creating the event file input to gtbin. For both options the event file must be created for the particular time range.
For both binning options you control the rectilinear spatial grid: the number of pixels in each direction, their size, the coordinate system, the center of the grid, and the type of projection. Ten projections are provided (see Calabretta & Greisen 2002, A&A, 395, 1077); AIT for 'Aitoff' is suggested.

You must also provide the energy bands used for the CCUBE option. You have three options:
- Linear binning ('LIN')—you provide the minimum and maximum energies and the number of bins.
- Logarithmic (the 'LOG' option)—you provide the minimum and maximum energies and the number of bins, and the software will calculate the bin edges. This will probably be your default.
- User specified energy bins (the 'FILE' option)—you provide the name of the FITS file with the energy binning. The gtbindef tool converts an ASCII file with the energy bands into the properly formatted FITS file.
The resulting output map files can then be viewed by fv or ds9. For examples, see the 'Explore the LAT data,' and 'Explore the LAT Data (Bursts)' threads.
» Forward to Livetime and Exposure
» Back to Lightcurves
» Back to the beginning of Data Exploration
» Back to the beginning of the Cicerone


