LAT All-Sky Survey Observations following the -Y SADA Anomaly
During the first 10 years of its mission, the Fermi satellite predominantly operated in a sky-survey mode where the pointing direction was rocked by 50° from the zenith to the north of the orbital plane for one spacecraft orbit, then rocked to the south by 50° for the next orbit. This way the entire sky was monitored every approximately 90 minutes. Interspersed with these were less-frequent pointed target-of-opportunity observations.
On March 16 2018, the Solar Array Drive Assembly (SADA) for Fermi's -Y solar array, which is one of two solar arrays on the spacecraft, experienced an anomaly. Although the array itself remains fully functional, the drive can no longer rotate the array. In order to maintain sufficient spacecraft power, while also maintaining thermal control, Fermi's observing program has been modified. The observing mode used now depends on the angle between the orbital plane and the Sun, i.e. the beta angle. This angle varies on both a yearly timescale and with an approximate period of 46 days (driven by the precession of Fermi's orbit).
Currently, Fermi observations are done in three ways: (i) When the absolute beta angle is less than 14°, the previous observing mode is still used, i.e. the rock angle alternates above and below the orbital plane with a two orbit repeat period. (ii) For intermediate absolute beta angles (14° < beta < 24°) an asymmetric profile is used alternating between an offset of 50° in one direction, and 60° in the other. (iii) When the beta angle is above 24° then a more complicated mode is used. During spacecraft day the pointing direction is offset from the orbital plane with a sine-wave like profile, with a maximum of 50° at orbit noon, and 0° near orbit "6 am" and "6 pm". The sign of the offset is the same as the sign of the beta angle. During orbit night, there is a fixed offset of 50° with the opposite sign from that during orbit day. This profile thus repeats with a period of one spacecraft orbit rather than two orbits. The individual rocking profiles used (both past and present) can be found on LAT All-Sky Survey Observations.
During observing modes (i) and (ii) full sky coverage is maintained. During mode (iii) most of the sky is observed, although with some gaps. The modes employed may be refined in the future. To determine which observing mode or modes were active during a given period, please refer to the FSSC's Observations Timeline page.
A natural question that the reader might have at this point could be: "What is the minimum time necessary to achieve full sky coverage?" Full sky coverage will be achieved every three hours (i.e. two orbits) when modes (i) and (ii) are in use. Full sky coverage on short (~hours) timescales will not be possible when mode (iii) is in use, and will instead be achieved within a week (see discussion in next section).
Examples of the sky coverage obtained in the various observing modes currently employed are shown in the following section. The predicted beta angle covering the entire year of 2019 can be found at the bottom of this page.
Effects of Rocking Profiles on Observing Efficiency
The following all-sky exposure maps were made over a 2-orbit (11426s) period during which only the indicated sky survey profile was active. Each map was created with the Aitoff projection, which allowed each pixel in the resulting image to cover the same area of sky. For ease of comparison, each map has been normalized by dividing the exposure at each pixel by the average exposure of that map.
The accompanying histograms divide the exposure values for the individual pixel into 200 bins, with a red dashed line indicating the average exposure of the map and magenta dotted line indicating 50% of the average.
The statistics accompanying the figures list the fraction of sky with 0 coverage and fraction of sky exposed. The "fraction of the sky exposed" is calculated as the number of pixels with exposures greater than the mean exposure, divided by the total number of pixels.
±50° profile
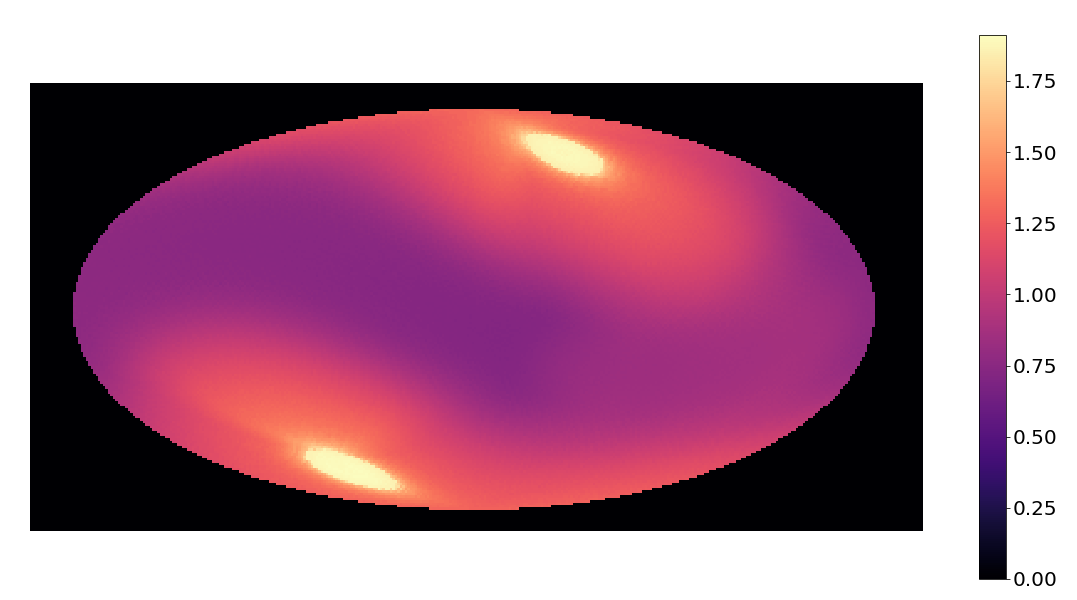

| Fraction of sky with 0 coverage | 0.00 |
| Fraction of sky exposed | 1.00 |
The ±50° rocking profile has been used for the majority of Fermi's mission lifetime, and affords coverage of the entire sky every three hours. Additionally, all parts of the sky are observed at greater than 50% of the mean exposure.
+50°/-60° profile
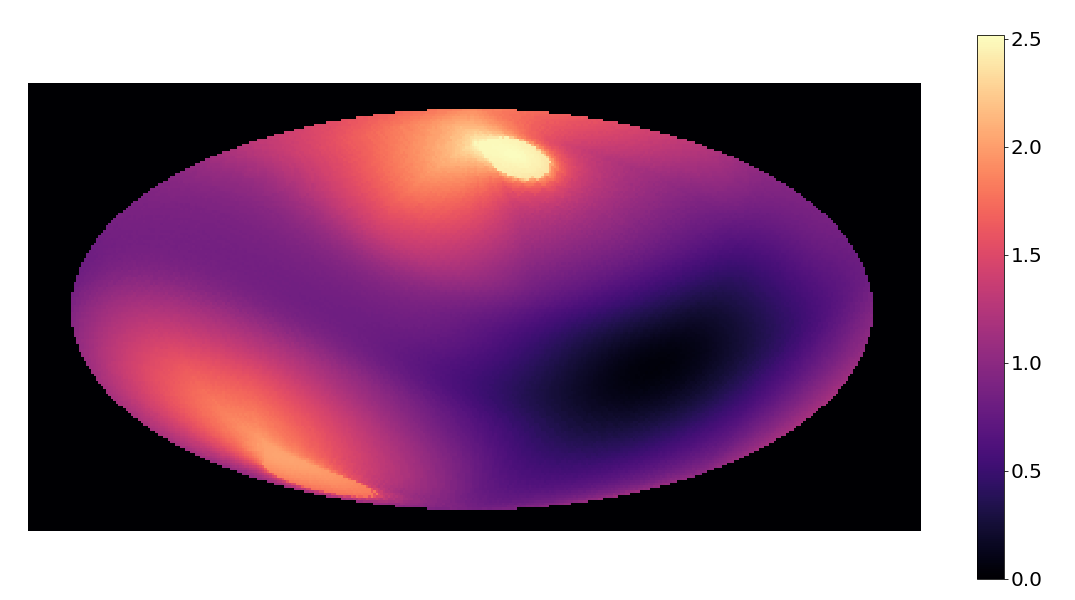

| Fraction of sky with 0 coverage | 0.00 |
| Fraction of sky exposed | 0.85 |
The +50°/-60° profile also affords all-sky coverage every two orbits, though the fraction of the sky that is fully exposed decreases to approximately 85%. Note that the hemisphere toward which the spacecraft is rocked 60° will change as with the sign of the beta angle. is also displayed.
50° partial sinusoidal profile
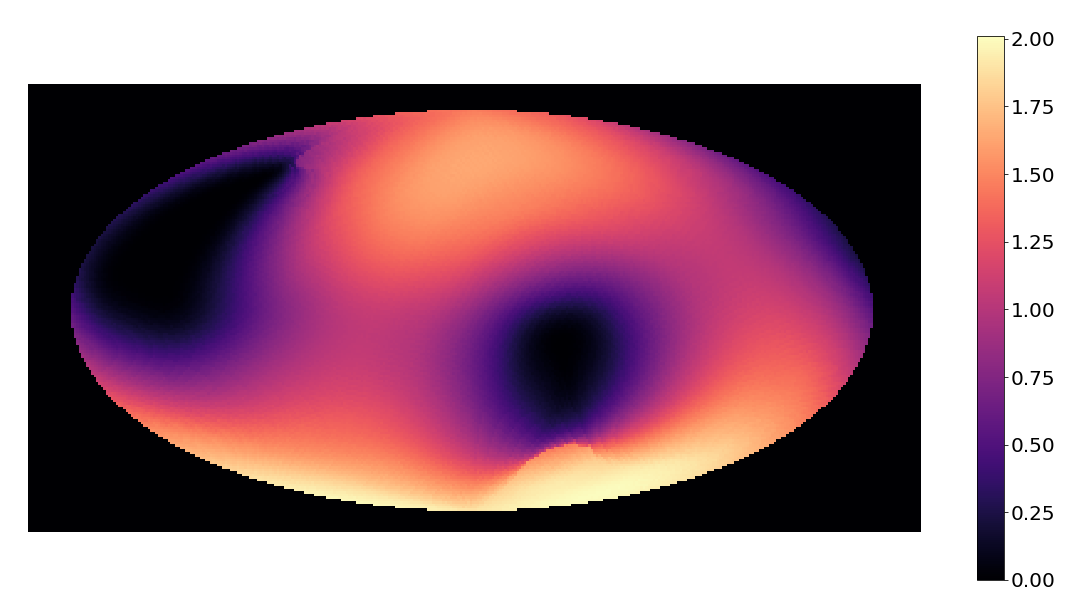

| Fraction of sky with 0 coverage | 0.015 |
| Fraction of sky exposed | 0.807 |
The partial sine profile is the same every orbit, which results in near-complete coverage of the entire sky approximately every 90 minutes. However, a small percentage of the sky (approx. 1.5%) will not be covered when this profile is active, and the fraction of the sky that is fully exposed decreases to about 0.81. The blind spot precesses with the orbit and complete sky coverage is reached within a week.
Beta Angle During the Year
As mentioned above, the beta angle varies continuously on both a yearly cycle and as a result of the approximately 46-day precession period, with a range of nearly ±50°. The figure below plots the value of the beta angle throughout the entire year of 2019. It is color-coded to indicate which type profile will be employed as the beta angle changes: GREEN for 2-sided rocking over 2 orbits, and GREY for the profile that utilizes sinusoidal rocking during orbit "day" with fixed rocking to the opposite hemisphere during orbit "night".
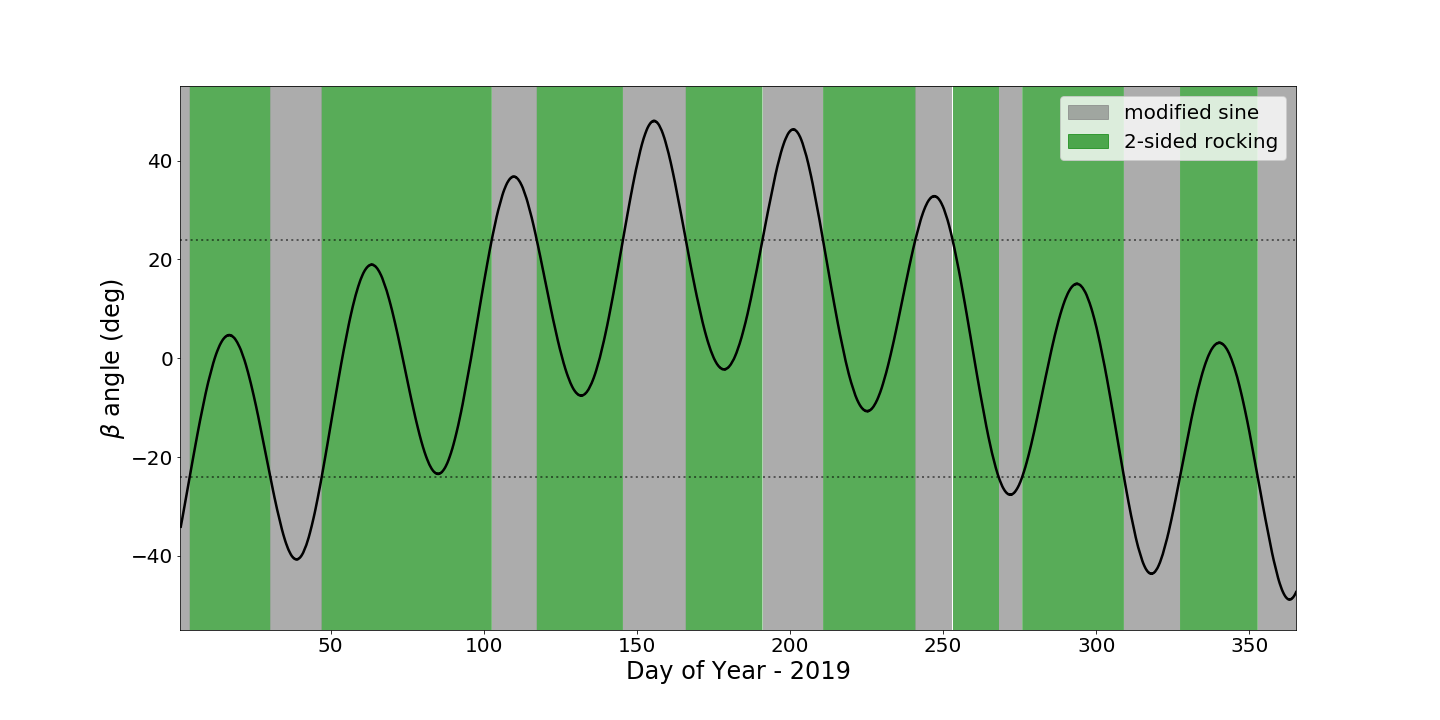
As can be seen in the above figure, the spacecraft spends a majority of its time - 66% - in one of the two-sided rocking modes, which allow coverage of the entire sky every 3 hours. The remaining 34% of the time is spent in the mode with the sinusoidal component, and occurs in time spans lasting from approximately one to a few weeks.